

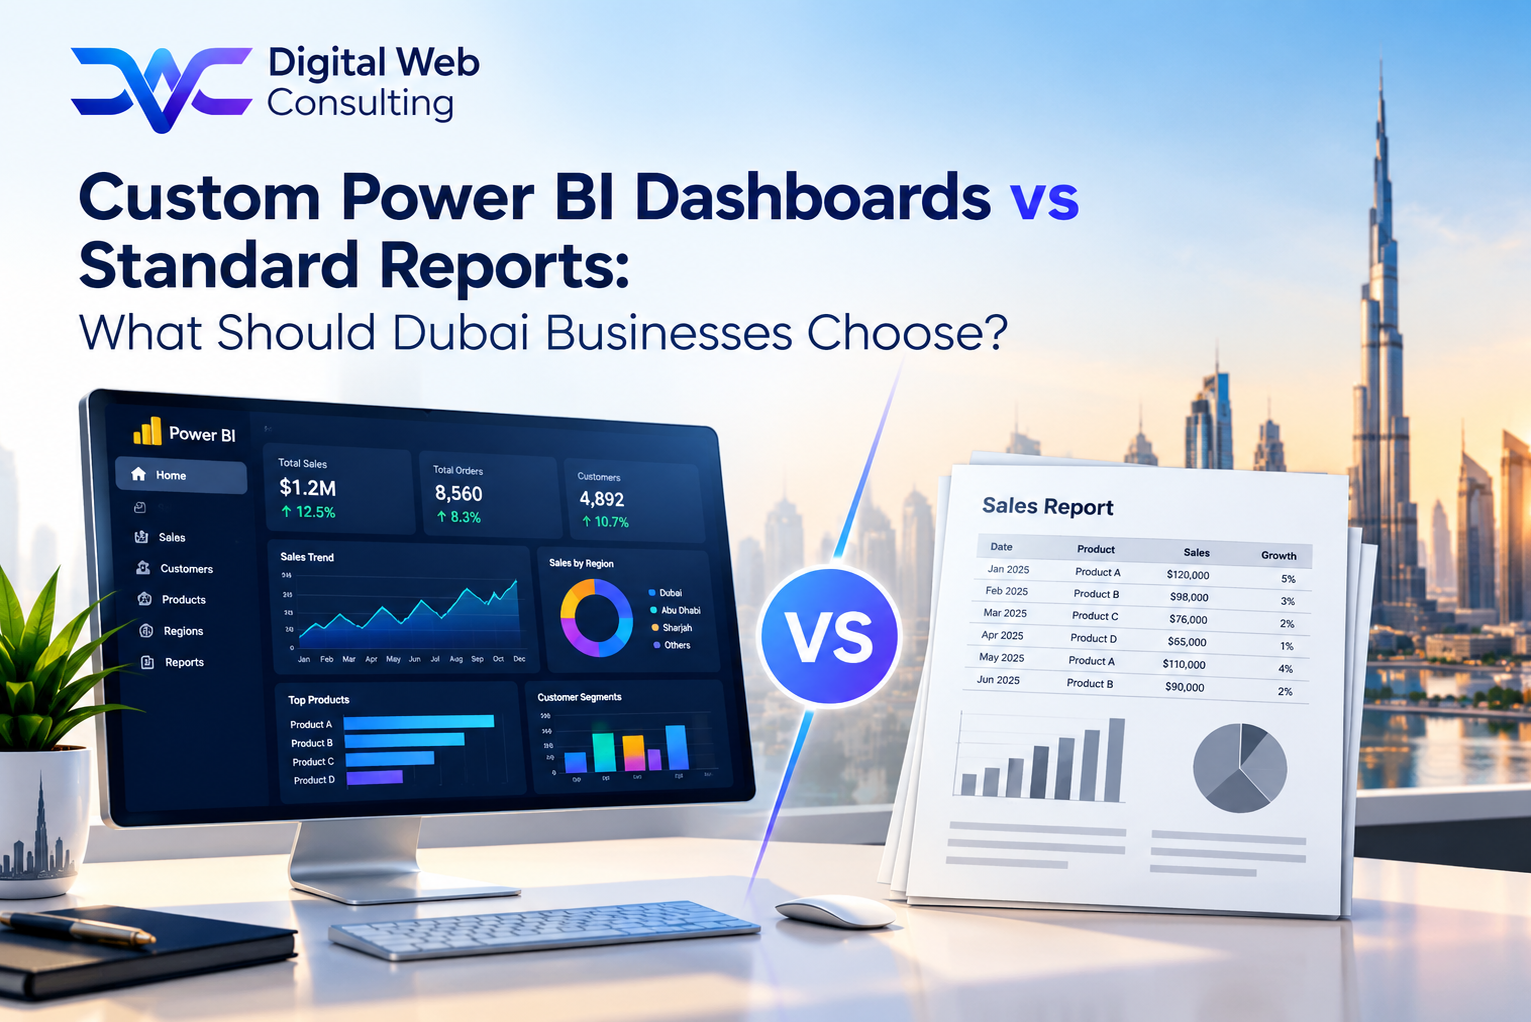
The Choice Most Dubai Businesses Face Without Naming It
Almost every Dubai business already has standard reports. The accounting system produces a trial balance and aged receivables. The CRM shows deals by stage. The inventory module lists stock on hand. These reports cost nothing extra, and for many businesses they are enough for years.
The question arises when leadership starts asking things that no single report answers: how profit by customer compares across systems, whether this month's pipeline will cover next month's costs, or which supplier delays are hurting delivery. At that point the choice is between stretching standard reports with spreadsheets or building custom Power BI dashboards.
Power BI dashboard development services in Dubai are the right answer for some businesses and an unnecessary expense for others. This guide sets out what each option does well, where each falls short, how they compare side by side, and five questions that settle the decision.
The right choice is the one that answers the decisions the business actually makes, at a cost those decisions justify. Sometimes that is a standard report.
What Standard Reports Do Well
Standard reports are the built-in reports of the systems a business already runs, together with the exports and templates that come with them. They have real strengths.
• Ready on day one: They exist as soon as the system is in use, with no development project.
• No separate build cost: They are included in the system's licence, and the vendor maintains them.
• Accurate for one system: A report drawn from a single system reflects exactly what that system holds.
• Familiar to finance teams: Statutory-style outputs such as a trial balance or a VAT summary follow formats that accountants already know.
• Low maintenance: Nobody in the business has to look after a separate reporting layer.
For a business whose decisions depend on one system and whose questions are conventional, standard reports may be all it needs.
Where Standard Reports Stop Being Enough
What built-in reports can do varies by system, but the same limits appear again and again as a business grows.
• Data spread across systems: A report from the accounting system cannot see the pipeline in the CRM or the delivery data in the logistics tool.
• Definitions that do not match the business: A standard margin or overdue calculation may differ from how the business defines it, so people rebuild it in a spreadsheet.
• Manual consolidation: When figures from several sources must be combined by hand each month, time is lost and errors creep in.
• One view for everyone: Different users need different slices, and standard reports are often a single fixed layout.
• Limited visual and mobile use: Leaders who want a quick view on a phone often find standard reports hard to read away from a desk.
• Slow to change: Adding a new measure usually means a request to the vendor or yet another spreadsheet.
What Custom Power BI Dashboards Add, and What They Cost
A custom dashboard environment connects several sources into one model, applies the business's own definitions, and presents role-based views that can refresh several times a day and be opened on a phone. Alerts can flag exceptions such as overdue receivables or low stock. For a UAE business the model can also hold AED-normalised figures, VAT separated from revenue, and Arabic text fields.
These gains come with real costs. There is a development project, a per-user licence fee, and ongoing support. The dashboards are only as accurate as the data behind them, so source data problems must be fixed first. And a dashboard environment needs an owner inside the business after go-live, or it drifts out of date.
How to Compare the Cost Fairly
Standard reports look free, but they carry a cost in staff time whenever people must fix, combine, or reformat them. A fair comparison therefore weighs two numbers. The first is the hours the business spends each month compiling reports by hand, multiplied by the cost of that time and by twelve. The second is the first-year cost of a custom environment, which includes development, per-user licences, and support.
If the first number is small, standard reports win. If it is large and growing, the second may pay for itself, though only if the dashboards are adopted and the manual work is actually retired.
A Side-by-Side Comparison
Data scope
Standard reports: Usually limited to what one system holds.
Custom dashboards: Combines several systems into one model.
Fit with the business's definitions
Standard reports: Uses the vendor's definitions, which may differ from the business's own.
Custom dashboards: Uses definitions agreed with the business and applied everywhere.
Time to first use
Standard reports: Immediate.
Custom dashboards: Weeks, typically six to ten for a multi-function scope.
Ongoing cost and upkeep
Standard reports: Included with the system and maintained by the vendor.
Custom dashboards: Licence fees per user and a support arrangement, plus an owner inside the business.
Adaptability
Standard reports: Changes depend on the vendor or on spreadsheets.
Custom dashboards: New measures and views can be added to the model, provided the data is available.
Five Questions That Settle the Decision
Answer these honestly before commissioning anything.
• Do your key decisions depend on data from more than one system?: If not, standard reports are likely enough. If so, you are already combining data by hand.
• Do the standard reports use your definitions?: If people routinely rebuild margin, overdue, or pipeline figures in spreadsheets, the definitions do not fit.
• How many hours a month go into compiling reports by hand?: A large and growing number is the clearest sign that the business has outgrown standard reports.
• Do different people need different views?: Regional, departmental, and executive users rarely want the same screen.
• Is the source data reliable?: If not, fix that first. A custom dashboard on poor data produces confident wrong answers.
Two or more clear yes answers to the first four questions suggest that custom dashboards are worth scoping. Mostly no answers suggest staying with standard reports for now.
A Worked Example
The following scenario is hypothetical. A Dubai trading company runs accounting in one system, sales in a CRM, and stock in a warehouse tool. Each month a finance assistant spends several days combining exports to answer three recurring questions: profit by customer, overdue receivables against the pipeline, and slow-moving stock. The standard reports in each system are accurate, but none answers those questions alone.
The company works through the five questions. Its decisions depend on three systems, its margin definition differs from the vendor's, the monthly compilation is long, and the directors want mobile access. The data is reliable. It scopes custom dashboards for finance and sales first, keeps the accounting system's statutory reports unchanged, and sets a date on which the manual combination of exports stops.
The Hybrid Most Businesses End Up With
Few businesses replace standard reports entirely. Statutory and compliance outputs, such as VAT returns and audit schedules, usually stay in the accounting system. Management dashboards in Power BI sit alongside them and draw on the same data. A sensible way to start is with one function, often finance or sales, and to extend only once the first dashboards are used every day.
For businesses weighing the decision, our Power BI Consulting Services include a short assessment that compares standard reports with a custom build for the specific systems and decisions involved. Where the answer is custom, our Power BI Dashboard Development service delivers it, and our ERP Integration Services connect the sources first.
Three Misconceptions Worth Clearing Up
• Custom dashboards replace the accounting system: They read from it. The accounting system remains the source of record.
• Power BI makes standard reports obsolete: Statutory and compliance reports still belong where the books are kept.
• A dashboard fixes messy data: It exposes data problems more clearly, but they still have to be fixed at the source.
Choose by Decisions, Not by Technology
Standard reports and custom Power BI dashboards are not rivals. Standard reports are the right tool for conventional questions answered from one system. Custom dashboards earn their cost when decisions depend on several systems, on the business's own definitions, and on views tailored to different users.
Power BI dashboard development services in Dubai are worth commissioning when those conditions apply and the source data can be trusted. The first practical step is to list the five decisions leadership makes most often, note which reports each one relies on today, and see how much of that work is still done by hand.
Not sure which side of this choice your business falls on? Start the conversation with Digital Web Consulting through our Power BI Dashboard Development Services page
[power bi dashboard development services in Dubai , Power BI services Dubai, Power BI development company Dubai , Microsoft Power BI Dubai]