

The Decision Quality Problem Most Dubai Businesses Do Not Name
Every decision a business makes is only as good as the information it is made from. This is not a controversial observation. Every managing director, finance director, and operations lead in Dubai would agree with it immediately. What is less immediately recognised is that most of the decisions made in a growing Dubai business are made from information that is days, weeks, or months old at the moment the decision is needed, and from information that has been compiled manually by someone whose primary job is not data compilation.
The managing director who asks the finance manager for the current revenue position on a Tuesday receives a number that reflects what the accounting system contained at the last reconciliation, adjusted by the finance manager's working knowledge of what has happened since. The sales director who asks for a pipeline update before a board meeting receives a summary that reflects what the sales team reported at the last weekly meeting. The operations manager who needs to know whether a customer's order can be fulfilled by the promised date asks the warehouse team and waits for an answer.
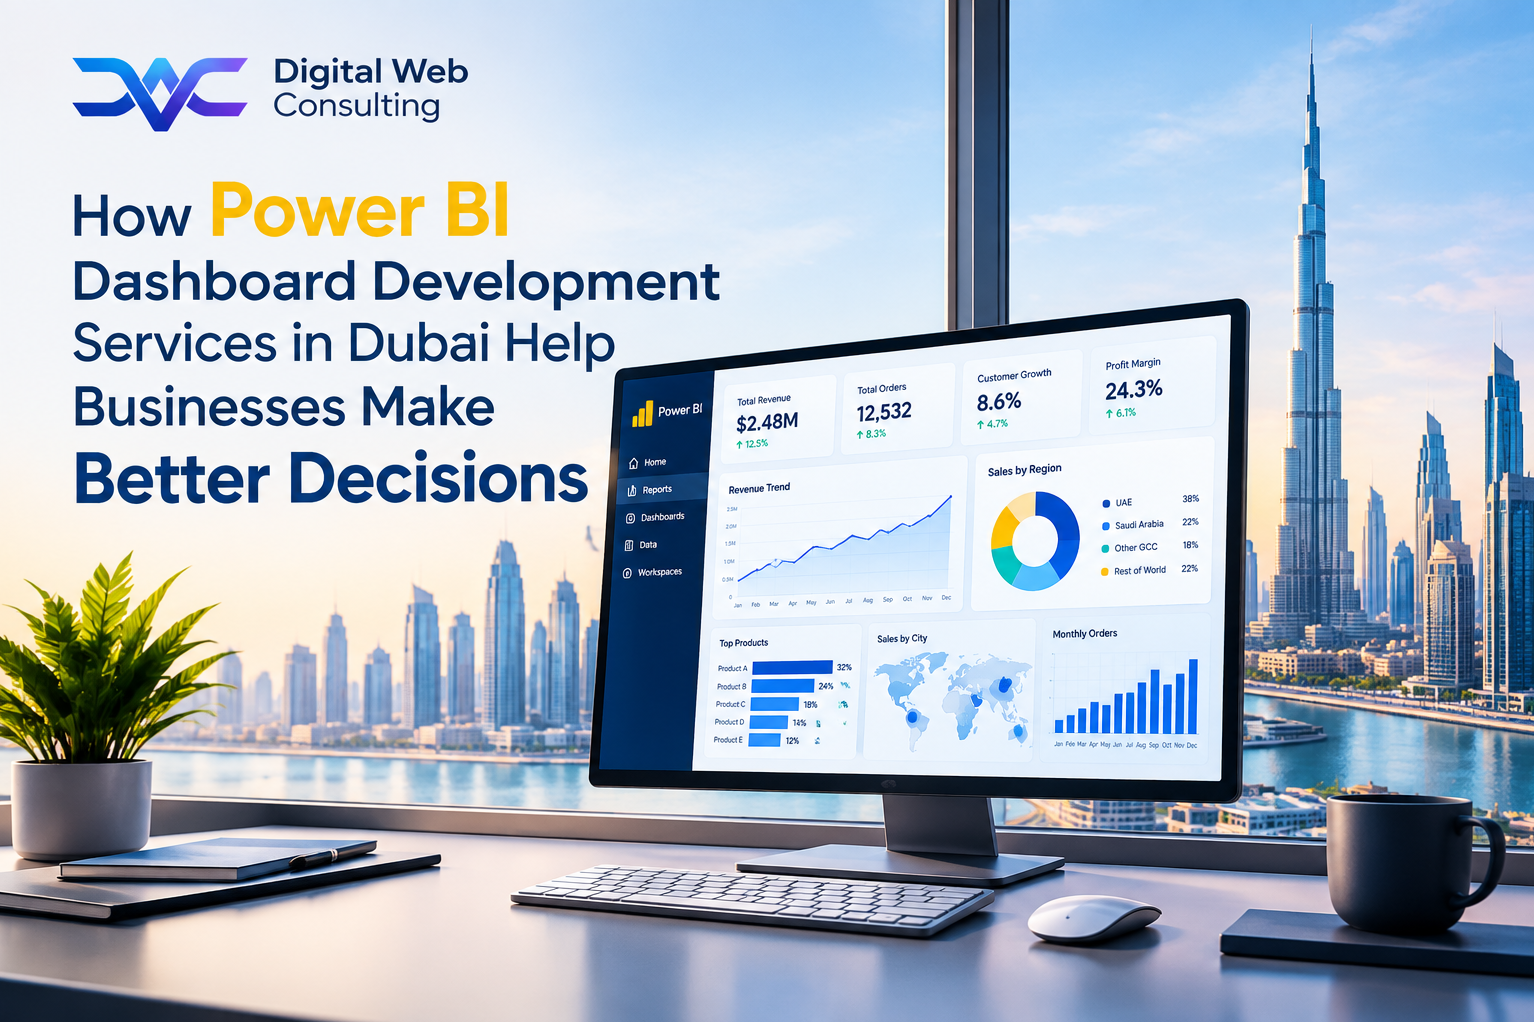
Power BI dashboard development services in Dubai address this problem at its root rather than at its symptoms. The symptoms are slow reports, stale data, and time consumed by information gathering. The root is that the decisions the business needs to make daily, weekly, and monthly are not supported by a real-time information infrastructure that makes the relevant data available at the moment the decision is needed. Power BI is that infrastructure. This guide describes specifically how it improves decision quality across the four domains where Dubai businesses make their most consequential choices.
The cost of a poor decision made from incomplete or outdated information is rarely attributed to the information quality. It is attributed to the decision. The managing director who committed too much stock because the inventory position they saw was two days old does not think of it as an information failure. They think of it as a misjudgment. Power BI does not eliminate misjudgments. It eliminates the information gaps that make good judgment impossible.
The decision quality improvements described in this guide reflect a Power BI environment that has been built correctly: on accurate data connections, with a properly structured data model, designed for the specific decisions of the specific business using it. A poorly built Power BI environment does not improve decision quality. It adds a layer of misleading data visualisation on top of the same information gaps. Implementation quality is the variable that determines whether the decision quality improvements described here become the business's reality.
How Power BI Changes Financial Decisions
Financial decisions are the domain where the gap between the information available and the information needed is most consistently wide and most consistently costly in a growing Dubai business. The cash position, the revenue trajectory, the margin by product or customer, and the VAT liability are all figures that change daily and are known accurately only at the point when someone compiles them from the accounting system. Power BI replaces that point-in-time compilation with a continuous, automatic update that makes these figures available at any moment without any compilation effort.
Cash Flow and Commitment Decisions
Whether to commit to a significant purchase or payment
Without Power BI: The managing director asks the finance manager for the current cash position. The finance manager checks the bank balance, adjusts mentally for outstanding payments and receivables they know about, and provides an estimate. The estimate is correct to the extent of the finance manager's knowledge at that moment but does not account for commitments in other parts of the business that have not yet reached the finance function.
With Power BI: The managing director opens the cash flow dashboard, which shows the current bank balance, the scheduled outflows for the next thirty days drawn from the accounts payable data, the expected inflows drawn from the accounts receivable aging, and the net projected cash position at any date within the next sixty days. The commitment decision is made from a complete, current picture rather than from an informed estimate.
Margin and Profitability Decisions
Which products, customers, or projects are the most and least profitable
Without Power BI: Margin analysis by product or customer requires a data extraction from the accounting system, a manual join with the sales and cost data, and a formatted report that takes hours to produce and reflects a period that has already closed. The managing director reviews it monthly at best and makes pricing and customer decisions based on patterns that may be three to four weeks old.
With Power BI: The margin dashboard shows gross margin by product line, by customer, and by project, updated automatically from the accounting and ERP data, for any date range the managing director selects. A pricing decision, a customer retention choice, or a product discontinuation decision is made from current margin data rather than from the last month's compiled report.
VAT and Compliance Decisions
Current VAT position and cash planning for the quarterly return
Without Power BI: The VAT liability for the current quarter is not known until the end of the quarter when the finance team compiles the return. Cash planning for the VAT payment is therefore based on an estimate rather than on a tracked figure, which produces either over-reservation that constrains working capital or under-reservation that creates a cash pressure at payment date.
With Power BI: The VAT dashboard shows the accumulated input and output tax for the current quarter, updated automatically from each transaction, giving the finance director a live view of the VAT liability at any point in the quarter. Cash planning for the quarterly payment is based on an accurate running figure rather than an end-of-quarter calculation.
For businesses whose financial data is distributed across multiple entities or multiple accounting platforms, our ERP Integration Services consolidate the financial data from every source into the Power BI data model before the financial dashboards are built, ensuring that the consolidated financial view is accurate across all entities rather than limited to the data visible in a single accounting system.
How Power BI Changes Sales and Commercial Decisions
Sales decisions made from a compiled pipeline report that was current three days ago are not the same as sales decisions made from a live pipeline view that reflects everything that happened this morning. The difference between these two information states is not just a matter of speed. It is a matter of what the decision-maker knows that is relevant to the decision at the moment they make it.
Pipeline Prioritisation Decisions
Where the sales team should focus its attention this week
Without Power BI: The sales director reviews the weekly pipeline report compiled by the sales operations coordinator and identifies which deals need attention based on the stages and values reported. Deals that have moved since the report was compiled are not reflected. Deals that have stalled and were not flagged are invisible. The prioritisation is made from a static snapshot.
With Power BI: The pipeline dashboard shows every deal at its current stage, with an automatic flag on deals that have not been updated in more than a defined number of days, and a weighted forecast that updates as deals move through stages. The sales director reviews the live dashboard and prioritises based on what the pipeline actually looks like today rather than what it looked like when the report was compiled.
Discount and Pricing Decisions
Whether to approve a discount request from the sales team
Without Power BI: The sales manager requests approval for a discount on a specific deal. The decision-maker weighs the discount against their general sense of the deal's strategic value, the customer's history, and the current pipeline pressure, without a clear view of the margin impact of the discount at the deal level or the pattern of discount requests across the team.
With Power BI: The pricing dashboard shows the margin at the quoted price, the margin impact of the requested discount, the customer's historical revenue and margin contribution, and the pattern of discounts approved across the team in the current quarter. The approval decision is made from a complete commercial picture rather than from judgment applied to an individual request in isolation.
Customer Retention Decisions
Which customers are at risk and need proactive account management attention
Without Power BI: Customer risk is identified reactively, when a customer raises a complaint, requests a price review, or fails to renew. The account management team addresses risk after it has manifested rather than before it becomes a threat to the relationship.
With Power BI: The customer health dashboard shows revenue trend by customer, purchase frequency, days since last order, and any open service issues, giving the account management team a proactive view of which customers are showing the early signals of disengagement before those signals become a formal risk. Retention decisions are made proactively rather than reactively.
How Power BI Changes Operational Decisions
Operational decisions in a Dubai business, about stock levels, supplier performance, order fulfilment, and resource allocation, are made most effectively when they are made from current operational data rather than from periodic reports. The decisions that produce the most operational friction in a growing business are almost always the ones made from information that was correct when it was compiled and incorrect by the time it was used.
Inventory and Procurement Decisions
When to reorder stock and how much to order
Without Power BI: Stock reorder decisions are made by the purchasing team based on their working knowledge of the inventory position, supplemented by periodic stock counts and informal feedback from the warehouse team. Stockouts are discovered at the point of order fulfilment rather than before. Over-ordering is discovered at the quarterly stock count rather than in time to adjust purchasing.
With Power BI: The inventory dashboard shows current stock levels for every SKU, updated automatically as goods are received and dispatched, with automatic reorder alerts when stock falls below the defined threshold. The purchasing team makes reorder decisions from a current inventory position rather than from an estimate, and stockouts are prevented rather than discovered.
Supplier Performance Decisions
Which suppliers to consolidate purchasing with and which to replace
Without Power BI: Supplier performance is assessed informally based on the purchasing team's experience and the complaints they receive from the warehouse and operations team. The decision to consolidate or replace a supplier is made from accumulated qualitative impressions rather than from tracked performance data.
With Power BI: The supplier performance dashboard shows on-time delivery rate, average lead time, lead time variability, and quality rejection rate for every supplier, calculated automatically from purchase order and goods receipt data. Supplier consolidation and replacement decisions are made from a comparative, data-grounded performance assessment rather than from qualitative impressions.
Resource Allocation Decisions
How to allocate the team's capacity across competing priorities
Without Power BI: Resource allocation decisions for professional services firms or project-based businesses are made in management meetings based on the project leads' verbal reports of their teams' current workload and capacity. The decision-maker works from a verbal summary of a position that may have changed since the project leads last checked.
With Power BI: The resource dashboard shows current utilisation by team member, the project allocation for each team member for the next four weeks, and the available capacity for new work or reallocation, updated automatically from the project management system. Allocation decisions are made from a complete, current picture of the team's capacity rather than from a verbal summary of it.
For businesses whose operational data is spread across a project management tool, a field service application, and a logistics platform that do not share data, our Power BI Dashboard Development service builds the data model that consolidates operational data from every source before the operational dashboards are built, ensuring the operational view is complete rather than limited to what a single system contains.
How Power BI Changes Strategic Decisions
Strategic decisions, about which markets to enter, which products to invest in, which customers to prioritise, and which operational improvements will produce the greatest return, are the decisions with the highest long-term consequences and the longest information-to-outcome lag. They are also the decisions that are most frequently made from historical data that was collected and compiled for operational purposes rather than for strategic insight.
Market and Product Investment Decisions
Which products or markets to invest in for the next twelve months
Without Power BI: Product and market investment decisions are made in the annual planning cycle based on the finance team's revenue and margin analysis, the sales team's assessment of pipeline trends, and the leadership team's qualitative assessment of market opportunity. The data that underpins the financial analysis is historical and compiled for the analysis rather than maintained as a continuous view.
With Power BI: The strategic performance dashboard shows rolling twelve-month revenue and margin trends by product line, customer segment, and geography, alongside pipeline conversion rates and average deal values over the same period. The investment decision is made from a continuous, granular view of where the business has been performing well and where it has not, rather than from a point-in-time analysis compiled for the planning cycle.
Operational Investment Decisions
Which operational improvement to prioritise in the next quarter
Without Power BI: Operational investment decisions are made based on the most vocal operational complaints from the management team, the most recent operational failures, and the managing director's assessment of which problems are most costly. The assessment is qualitative and influenced by recency bias toward the most recent operational failures rather than toward the most costly ongoing patterns.
With Power BI: The operational performance dashboard shows the frequency, cost, and trend of the key operational friction points across the business, giving the management team an objective, quantified view of which operational problems are most costly and most persistent. Investment decisions are made from a ranked, data-grounded assessment of operational improvement opportunities rather than from qualitative impressions.
Headcount and Capacity Planning Decisions
When and where to add team capacity
Without Power BI: Headcount decisions are made when the management team feels that the business is stretched, based on the team's qualitative reports of workload pressure and the managing director's observation of delivery quality under the current team size. The decision to hire is reactive to felt capacity pressure rather than grounded in tracked utilisation and projected capacity.
With Power BI: The capacity planning dashboard shows current utilisation by team and function, the projected utilisation based on the confirmed pipeline and existing workload, and the lead time required to hire and onboard new capacity in each function. Headcount decisions are made from a forward-looking, data-grounded capacity assessment that anticipates pressure before it affects delivery quality.
What Good Dashboard Development Services Do to Maximise Decision Value
The decision quality improvements described in this guide do not come from Power BI as a platform. They come from a Power BI environment that was built around the specific decisions the specific business needs to make. A dashboard that was not designed with a specific decision in mind does not improve the quality of that decision. It displays data in a way that may or may not be relevant to the decision at the moment it is made.
Decision-First Design
A Power BI development service that maximises decision value begins every engagement by asking each stakeholder to identify the two or three decisions they make most frequently that currently take too long, use too little information, or produce outcomes they later need to correct. These decisions define the dashboard requirements. The data model is built to support these decisions. The visualisations are designed to answer these questions in the fewest possible clicks. The result is a dashboard environment that is used because it answers the questions the business is asking, not because it displays the data the system has available.
Data Model Integrity
A dashboard that shows inaccurate data does not improve decision quality. It actively undermines it by providing false confidence in decisions made from wrong numbers. Data model integrity, built through a structured data audit before any dashboard is designed and maintained through consistent data validation after go-live, is the foundation of every decision quality improvement described in this guide. Without it, Power BI adds a layer of misleading visualisation rather than a layer of genuine insight.
Adoption That Reaches Every Decision-Maker
A Power BI dashboard that is used by the finance director but not by the sales director, or by the managing director but not by the operations manager, improves the decision quality of the users and not the non-users. Full decision quality improvement across the business requires that every decision-maker who would benefit from the dashboard data is trained to use it, has the dashboards designed for their specific decisions, and develops the habit of checking them as part of their daily working routine.
The adoption workstream of a Power BI development engagement is not a training programme delivered once at go-live. It is a structured process that builds the data-checking habit across the leadership team over the first sixty to ninety days of live use, with defined adoption metrics, regular usage review, and targeted support for the decision-makers who are not yet using the dashboards as a primary information source.
For businesses ready to build a Power BI environment designed specifically around their highest-value decisions, our Power BI Consulting Services service begins every engagement with a decision mapping session that produces the dashboard requirements from the decisions that matter most to the specific business rather than from a generic list of available KPIs.
Better decisions do not come from more data. They come from the right data, available at the right moment, in a format that makes its relevance to the decision immediately clear. Power BI delivers that when it is built around the decisions the business actually makes rather than around the data the business happens to have.
The Return on Better Decisions Compounds Every Day
The financial decisions, the sales decisions, the operational decisions, and the strategic decisions described in this guide are not special cases. They are the decisions that every growing Dubai business makes every week. Each one is marginally better when it is made from current, accurate, complete data rather than from a compiled estimate. The compounding effect of marginally better decisions, made consistently across every domain of the business, every week, over twelve months, is the return that makes Power BI one of the most cost-effective technology investments available to a growing Dubai business.
Power BI dashboard development services in Dubai that are built around the specific decisions of a specific business, on accurate data, with adoption designed into the delivery approach from the first session, produce this compounding return consistently. The dashboards are the infrastructure. The better decisions they enable are the return. And the return begins accumulating from the first Monday morning that the managing director opens the dashboard instead of making three phone calls to find out where the business stands.
The decision quality gap that most Dubai businesses do not name is visible everywhere in how they work: in the time spent gathering information before decisions, in the corrections made after decisions, and in the opportunities missed because the data that would have revealed them arrived too late to act on. Power BI closes that gap. The right development service builds it so that it stays closed.
Ready to build a Power BI environment in Dubai designed around your highest-value decisions rather than around generic KPIs? Start the conversation with Digital Web Consulting through our Power BI Dashboard Development Services page
[power bi dashboard development services in Dubai , Power BI services Dubai , Power BI development company Dubai , Microsoft Power BI Dubai]