

The Gap Between Having Data and Being Able to Use It
Almost every Dubai business is data-rich and insight-poor. The ERP records every transaction. The CRM logs every customer interaction. The accounting platform holds the complete financial picture. The HR system carries the headcount and payroll data. And yet when leadership wants to understand the actual operational position of the business — right now, across all of these dimensions simultaneously — the answer involves someone spending half a day pulling reports, combining spreadsheets, and producing a summary that is already outdated by the time it arrives.
This is not a data problem. The data exists. It is a visibility problem — and it is the problem that Power BI dashboard development services in Dubai are specifically designed to solve. Not by creating new data, but by connecting the data the business already generates and making it visible, accurate, and instantly accessible to every person who needs it, in the format relevant to their role, updated automatically as the business operates.
Understanding exactly how that transformation happens — what the development service does at each stage, what it needs from the business, and what it produces at the end — removes the uncertainty that makes many Dubai businesses delay a decision they should have made months earlier.
3.5 hours the average time a Dubai finance or operations professional spends per day on manual data gathering and report preparation that Power BI dashboards could eliminate entirely — Gartner Business Intelligence Productivity Report, 2024
“ The question is not whether your business has enough data for Power BI to be useful. If you are running an ERP, a CRM, or an accounting platform, you have more than enough. The question is whether that data is currently working for you — or sitting in systems where it cannot be seen, combined, or acted on in real time. ”
The process described in this guide applies to any Dubai business commissioning Power BI dashboard development services — regardless of industry, team size, or current technology stack. The stages are consistent. The UAE-specific considerations within each stage are what differentiate providers with genuine local experience from those applying a generic methodology.
STAGE ONE : Discovery and Data Source Mapping
Every Power BI dashboard development service in Dubai should begin with discovery — not with design. Discovery is the structured process of understanding what data the business holds, where it lives, how it is structured, and how reliable it is before any dashboard design begins. Skipping this stage and moving directly to design is the most common reason Power BI projects produce dashboards that look good but show numbers nobody trusts.
Discovery involves two parallel workstreams that inform each other:
• Stakeholder interviews: The development team works with leadership, finance, sales, operations, and HR to identify the specific questions each function needs answered from its data. Not general reporting requirements, but the specific decisions each person makes daily where better data visibility would change the quality or speed of that decision. These interviews produce the KPI list that drives every design decision in the stages that follow.
• Data source audit: Every system the business runs is assessed for the data it holds, the format that data is stored in, the method available for connecting Power BI to it, the frequency at which data is updated, and the quality and completeness of the records. This audit identifies connection methods — DirectQuery for live data, scheduled import for systems that support batch refresh, manual upload for data sources without API access — and surfaces data quality issues that need to be resolved before the data can be modelled accurately.
• Data source map production: The output of the audit is a data source map — a documented inventory of every data source in scope, its connection method, its refresh frequency, its data quality status, and the specific fields within it that are needed for the dashboards being built. This map becomes the technical blueprint for the data model design stage and the maintenance reference for every future change to the Power BI environment.
The discovery stage typically takes one to two weeks for a Dubai business with three to six data sources. Businesses with more sources, legacy systems with non-standard data structures, or data quality problems that need remediation before modelling can begin will sit at the longer end of this range.
For businesses whose discovery stage reveals significant data quality issues across their source systems — missing fields, inconsistent coding, duplicated records — our ERP Integration Services address the source system data quality and connectivity issues that prevent Power BI from accessing clean, reliable data in the first place.
The discovery stage is the part of the process most commonly abbreviated under time pressure — and the one whose quality most directly determines whether the finished dashboards are trusted and used or quietly ignored. A thorough data source audit before modelling begins is the highest-return investment in the entire engagement.
STAGE TWO : Data Model Design and Transformation
The data model is the most important invisible component of any Power BI implementation. It is the layer that sits between the raw data in the source systems and the dashboards the business sees — transforming operational data into a clean, consistent, analytically ready structure from which accurate reports and visualisations can be generated.
A poorly designed data model produces dashboards where the numbers are slightly wrong in ways that are hard to identify, where filters do not behave as expected, where performance degrades as data volume grows, and where adding a new dashboard requires rebuilding large portions of the model. A well-designed data model produces dashboards where every number is accurate, every filter works correctly, performance is fast even at high data volume, and new dashboards can be added incrementally without architectural rework.
The data model design process involves three core components:
• Schema design: The relationships between data entities across connected systems are mapped and structured in a way that supports the analytical queries the dashboards will run. For a Dubai trading company, this means connecting the sales order data from the ERP to the customer records from the CRM to the invoice data from the accounting platform — with the relationships defined precisely enough that a single filter applied to a customer name correctly filters data across all three connected datasets simultaneously.
• Transformation logic: Raw operational data is almost never in the format Power BI needs for accurate analytics. Dates stored as text need to be converted to proper date fields. Currency values need to be normalised to a common functional currency for consolidated reporting. Status codes need to be mapped to human-readable labels. Calculated measures — gross margin percentage, days sales outstanding, stock turnover rate — need to be defined once in the model so they calculate consistently across every dashboard that uses them.
• UAE-specific transformation requirements: Dubai businesses have a specific set of transformation requirements that a provider without UAE implementation experience will not anticipate. These need to be handled correctly at the model level:
• 🇦🇪 VAT calculation and FTA compliance: VAT data needs to be structured in the model to support both transaction-level VAT visibility and period-level FTA return preparation — which requires specific field mapping and calculation logic that generic Power BI implementations do not include by default.
• 🇦🇪 Multi-currency normalisation: Transactions recorded in AED, USD, EUR, and other currencies need to be normalised to AED for consolidated reporting while maintaining the ability to view individual transactions in their original currency — a dual-currency model that requires explicit design.
• 🇦🇪 Arabic text handling: Data fields containing Arabic text — customer names, product descriptions, location names — need to be handled correctly in the model to ensure right-to-left text renders accurately in dashboard visuals and that Arabic-language filters work as expected.
The data model design stage typically takes two to three weeks for a mid-complexity Dubai implementation. This is the stage where the Power BI developer's experience level is most visible — experienced developers make model design decisions that hold up under evolving requirements, while less experienced ones create models that work initially but require significant rework as new dashboards are added.
Businesses reviewing Power BI proposals should ask every provider specifically how they design their data models and what their approach is to UAE-specific transformation requirements. The quality of the answer to this question is the most reliable technical differentiator between providers in the Dubai market.
STAGE THREE : Dashboard Design and KPI Alignment
With a validated data model in place, the dashboard design stage translates the KPI list developed during discovery into interactive visualisations that answer the specific questions each user group needs answered. This stage involves the closest collaboration between the development team and the business — and the quality of that collaboration determines whether the finished dashboards reflect how the business actually thinks about its data or how a generic template assumes it might.
• KPI validation and prioritisation: The KPI list from the discovery stage is reviewed with each stakeholder to confirm that the metrics identified are the ones that drive actual decisions — not just the ones that are easiest to visualise or most commonly seen in example dashboards. Some KPIs identified during discovery will not be supportable from available data; others will need to be redefined to align with how the data is actually structured in the source systems. This validation produces a confirmed, prioritised KPI list that is achievable with the data that exists.
• Visual type selection: Each KPI is matched to the visual type that communicates it most clearly — trend lines for metrics that need to be understood over time, bar charts for comparisons across categories, gauges for performance against targets, tables for detailed drill-through data, maps for geographic distribution. Visual type selection is a design decision, not a style preference — the wrong visual type makes the right data harder to understand rather than easier.
• Filter and drill-through logic design: The interactive layer of the dashboard — the filters, slicers, drill-through paths, and cross-report navigation — is designed to match how users naturally explore their data. A finance director who wants to understand why gross margin has declined should be able to click from the summary metric to the product category detail to the individual transaction in a natural, intuitive sequence. This navigation logic is designed at the dashboard design stage and validated during the review cycle.
• Review cycles: A first-version dashboard is shared with the relevant business stakeholders for review and feedback. A well-structured review process separates visual feedback — layout, colour, label clarity — from data accuracy feedback — metric calculations, filter behaviour, number formatting. Typically two review cycles are included in a well-scoped Power BI engagement: one structural review and one refinement review before the dashboard is moved to testing.
“ The most important dashboard design principle is also the simplest: if a stakeholder cannot read the dashboard and make a decision within sixty seconds, the design has not served the business. Complexity in a Power BI dashboard is almost always a sign that the KPI alignment work was not done thoroughly enough — not a sign of analytical sophistication. ”
The review cycle is the stage where business stakeholders have the most influence over the final output — and where that influence is most efficiently applied. Feedback provided during the design stage takes hours to incorporate. The same feedback provided after go-live takes days.
STAGE FOUR : Testing, Access Setup, and Go-Live
A Power BI dashboard that has not been tested against real business data before go-live is a liability — not because the design is wrong, but because the data model may have gaps that only appear when live data volumes and real business scenarios are applied. The testing stage is what separates a dashboard that the business trusts from one that creates uncertainty the moment a number does not match expectations.
• Data validation testing: Each metric on each dashboard is validated against a known correct value from the source system. For a sales revenue figure, this means comparing the Power BI calculation against the ERP's own sales report for the same period. For an inventory value, it means matching the Power BI total against a verified stock count. Every discrepancy is investigated and resolved before go-live — because a discrepancy discovered after go-live undermines confidence in the entire dashboard environment.
• Performance testing: Dashboards are loaded under realistic conditions — with the full volume of live data, with multiple users accessing simultaneously, with complex filters applied — to confirm that refresh times are acceptable for daily use. Performance problems discovered during testing are resolved through model optimisation. Performance problems discovered after go-live require the business to use dashboards that frustrate rather than serve.
• Role-based access configuration: Each user group is configured with the appropriate level of data access — ensuring finance leadership can see consolidated group data, sales managers can see their team's pipeline but not other teams', and executives can see the cross-functional summary without navigating to individual transaction records. Row-level security is configured in the data model and tested against each role before access is provisioned.
• Distribution setup and go-live: The delivery method for each user group is configured — Power BI Service web access, Power BI mobile app, embedded dashboards within other business tools, or scheduled email delivery of specific reports. Users are provisioned with the appropriate licences and access levels. A phased go-live — rolling out to one user group at a time — reduces the risk of widespread issues appearing simultaneously.
• Hypercare period: The two to four weeks immediately after go-live are the highest-risk period for any Power BI implementation. Data anomalies that testing did not catch surface when real users apply real business scenarios. The hypercare period provides dedicated support for these issues — investigating discrepancies, adjusting model logic, and refining dashboards based on how users are actually interacting with them in live conditions.
For businesses embedding Power BI dashboards within their existing ERP or CRM platforms as part of go-live, our ERP Software Development and CRM Integration Services cover the integration layer that connects Power BI to the business's operational systems reliably and maintains that connection as both systems evolve.
Go-live is not the end of the engagement — it is the beginning of the period when the dashboards face their most demanding test. A provider whose engagement ends at go-live has not thought through what real-world usage reveals. A provider whose engagement includes a structured hypercare period has.
What Ongoing Power BI Dashboard Services Include After Go-Live
The initial Power BI dashboard development engagement delivers a working, tested, live dashboard environment. The ongoing service that follows is what determines whether that environment continues to deliver value as the business grows, its data sources evolve, and its analytical needs change. Here is what a well-structured ongoing Power BI development service in Dubai should include:
• Data source updates and schema changes: Every time a source system updates — a new module added to the ERP, a new field introduced in the CRM, a change in how the accounting platform codes transactions — the Power BI data model needs to be reviewed and updated accordingly. Without proactive monitoring, these changes silently break existing dashboards or introduce calculation errors that are not immediately visible. A good ongoing service includes monitoring for source system changes and proactive model updates before those changes affect dashboard accuracy.
• New dashboard requests and KPI additions: As the business evolves, new reporting requirements emerge — a new product line that needs its own P&L view, a new market entry that requires a geographic performance dashboard, a new KPI identified during a strategy review. An ongoing service should handle these additions incrementally against the existing data model rather than requiring a new development project for each new requirement.
• Performance monitoring and refresh optimisation: As data volumes grow over time, Power BI dashboards that performed well at implementation may begin to show slower load times and refresh delays. Proactive performance monitoring identifies these degradations before they significantly affect the user experience and allows model optimisation to be applied before the issue becomes disruptive.
• Annual data model reviews: Once a year, the data model should be reviewed against the business's current data environment and reporting requirements. New data sources may have been added. Business structure may have changed. Reporting requirements may have evolved beyond what the original model was designed to support. An annual review keeps the Power BI environment aligned with the business it serves rather than becoming a historical artefact of how the business operated when the dashboards were first built.
• User training for new team members: As team members change, new users need to be oriented to the dashboards relevant to their role. An ongoing service that includes periodic training for new users ensures the adoption rate achieved at go-live is maintained rather than degrading as institutional knowledge of how to use the dashboards is lost through staff turnover.
For businesses whose ongoing Power BI service needs to connect to evolving data sources as their technology stack grows, our Power BI Consulting Services provide the strategic advisory layer that ensures the Power BI environment evolves in alignment with the business's broader technology direction — not in isolation from it.
“ A Power BI dashboard environment that is not actively maintained will deliver its lowest value in year two — exactly when the business has grown to depend on it most. The ongoing service is not an optional add-on to the development engagement. It is the investment that protects the original development investment. ”
The businesses that get the most from Power BI over a three to five year horizon are the ones that treated the initial development as the beginning of an ongoing analytical capability rather than a one-time project. The dashboards that started as executive summaries evolve into the operational intelligence layer that runs the business — but only when the service behind them keeps pace with the business's growth.
The Process Is Straightforward When the Provider Knows What They Are Doing
The four stages described in this guide — discovery and data source mapping, data model design and transformation, dashboard design and KPI alignment, and testing with go-live — are not complicated when a provider has delivered them before. They are sequential, logical, and each one builds directly on the work of the previous stage. The result, when each stage is executed correctly, is a dashboard environment that the business trusts, that every relevant team member uses without being asked to, and that changes how leadership makes decisions every day.
What makes Power BI dashboard development services in Dubai variable in quality is not the stages themselves — those are consistent across providers — but the depth of execution within each stage. The thoroughness of the data source audit. The quality of the data model design. The accuracy of the UAE-specific transformation logic. The rigour of the data validation testing. And the structure of the ongoing service that keeps the dashboards accurate and evolving after go-live.
These are the dimensions that separate a Power BI implementation that becomes the most used tool in the business from one that is opened once after go-live and then quietly abandoned because the numbers never quite added up.
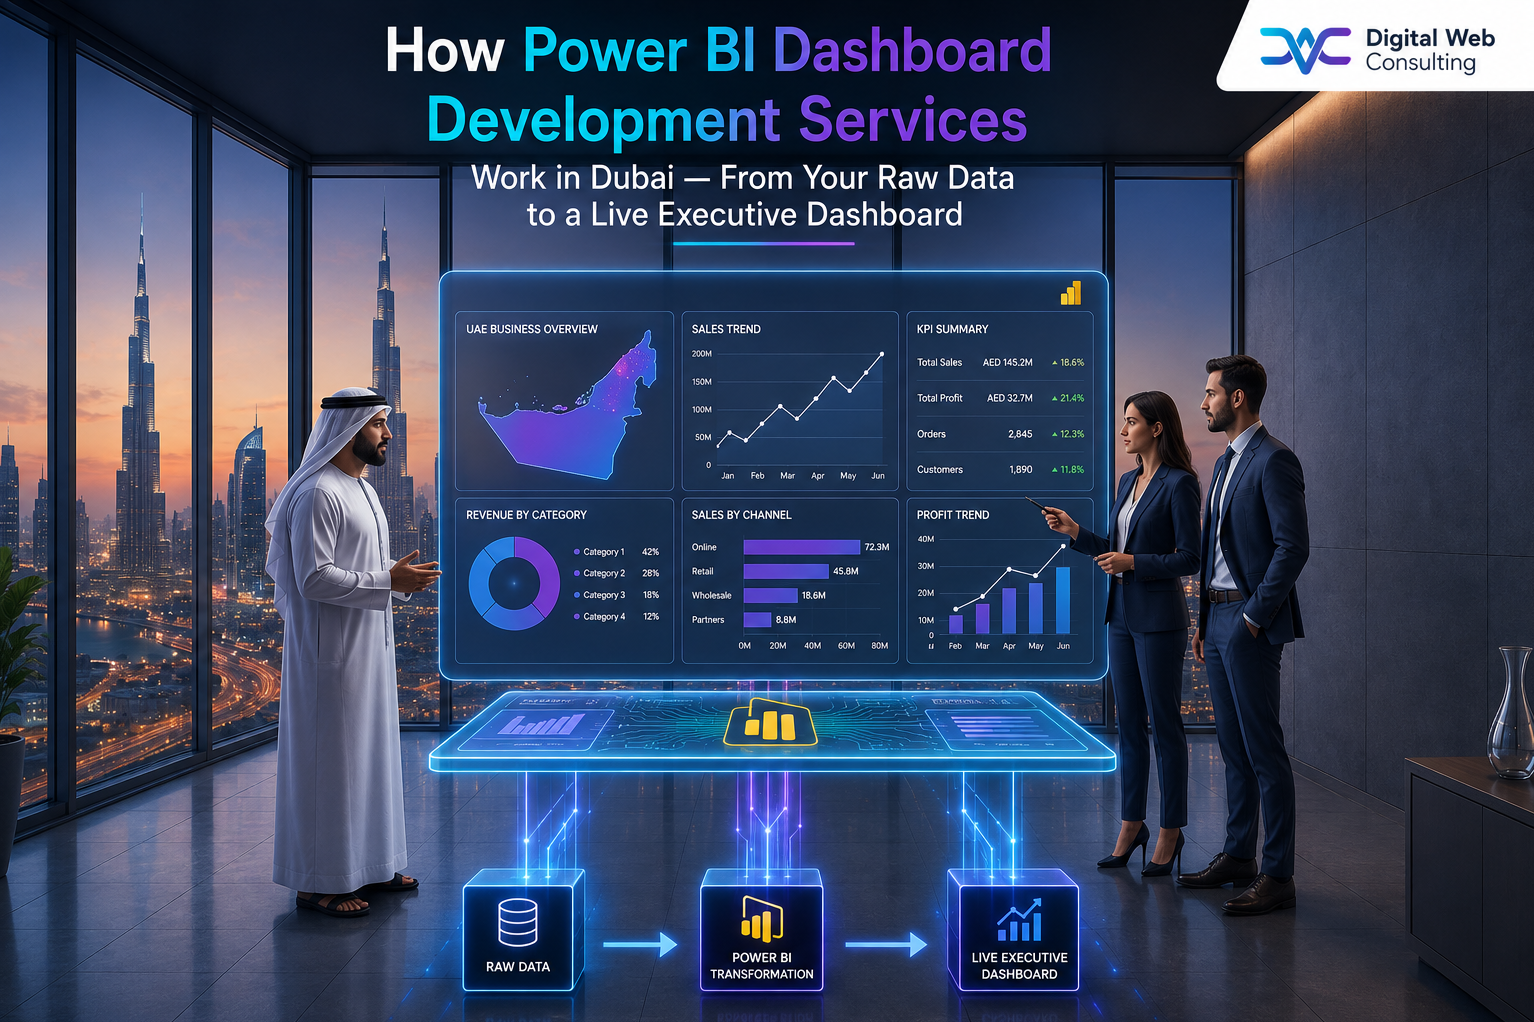
“ Raw data is already in your systems. Live executive dashboards are four structured stages away. The process is clear. The value is real. The only question is which provider has done this enough times in Dubai to execute each stage correctly the first time. ”
Ready to move from raw data across disconnected systems to live dashboards your leadership team actually uses? Start the conversation with Digital Web Consulting through our Power BI Dashboard Development Services page →
[power bi dashboard development services in Dubai , Power BI services Dubai, Power BI development company Dubai , Microsoft Power BI Dubai , how Power BI dashboard development works Dubai , Power BI service process UAE , Power BI developer Dubai]