


What Power BI Is in Plain Language
If you have ever wished you could see how your business is doing right now, without calling the finance manager, without waiting for the end-of-month report, and without asking anyone to put together a spreadsheet, Power BI is the answer to that wish.
Power BI is a software tool made by Microsoft that takes the data already sitting inside your business systems — your accounting software, your CRM, your ERP, your inventory system — and turns it into visual summaries that you can look at on a screen, in real time, without any technical knowledge required to read them. Those visual summaries are called dashboards.
Power BI dashboard development services in Dubai are the professional services that build those dashboards for you. A development service handles everything: connecting the tool to your business systems, building the visual layout, making sure the numbers are accurate, and training your team to use what was built. Your job is to describe what information you want to see. The development service's job is to make it visible.
What Power BI is not: it is not a replacement for your accounting software or your ERP. It does not store your operational data. It reads data from the systems that already hold it and presents that data in a format that is much easier to understand than a spreadsheet or a raw database report. The underlying systems stay exactly as they are. Power BI is the window that lets you see what is happening inside them.
You do not need to understand how Power BI works technically to benefit from it. You need to understand what information matters to how you run your business. The development service handles everything else.
This guide uses no technical jargon. Every concept is explained in plain business language. If a term does appear that is not immediately clear, it will be explained in the same sentence. The goal is that by the end of this guide, any business owner in Dubai can have a confident conversation with a Power BI provider without feeling at a disadvantage.
What a Power BI Dashboard Actually Looks Like
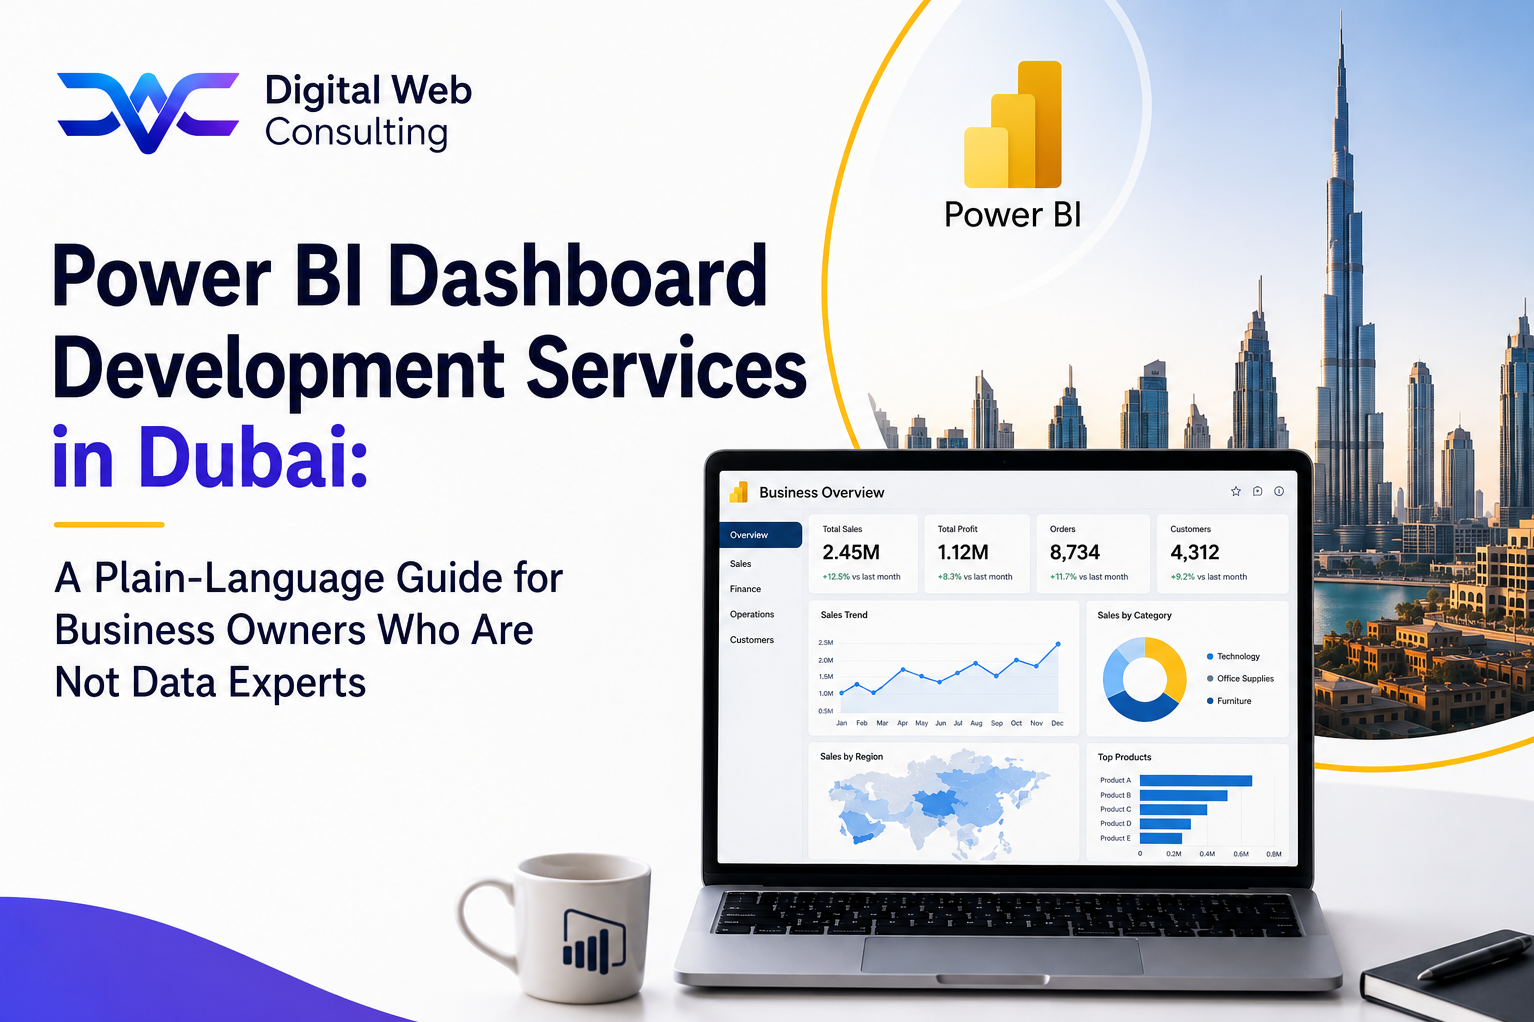
A Power BI dashboard is a screen, or a page, that shows you a collection of numbers, charts, and summaries drawn from your business data. It looks similar to a well-organised management report, except that it updates automatically and you can click on any number to see more detail behind it.
The information on a dashboard is grouped into visual tiles. A tile might show a single important number, like total revenue this month. Another tile might show a bar chart comparing revenue by product category. Another might show a trend line of how cash in the bank has moved over the past six months. Another might show a list of the top ten customers by order value this quarter. All of these tiles appear on the same screen simultaneously, giving you a complete picture of one aspect of the business at a glance.
What a Finance Dashboard Looks Like
A finance dashboard for a Dubai business typically shows the current month's revenue compared to the target, the gross profit margin for the month, the cash position updated daily as payments come in and go out, the value of outstanding invoices grouped by how long they have been unpaid, and the VAT liability accumulated so far in the current quarter. A finance director who opens this dashboard in the morning knows the financial position of the business before the first meeting of the day without asking anyone for anything.
What a Sales Dashboard Looks Like
A sales dashboard typically shows the total value of deals currently in the pipeline, how many deals are at each stage of the sales process, which deals have not been updated recently and may be at risk of going cold, the revenue generated by each sales team member this month against their individual target, and the conversion rate from initial contact to closed deal. A sales manager who opens this dashboard knows exactly which deals need attention today without holding a team update meeting.
What an Operations Dashboard Looks Like
An operations dashboard for a trading or distribution business typically shows the current stock level of each product against the minimum threshold that triggers a reorder, the number of orders received, dispatched, and outstanding today, the average time from order receipt to delivery for the current month compared to the target, and the performance of each supplier against their agreed delivery timelines. An operations manager who opens this dashboard has an accurate real-time picture of what is happening across the warehouse and the supply chain without making a single phone call.
These three dashboards, covering finance, sales, and operations, are the starting point for most growing Dubai businesses. For businesses whose operations span multiple industries or require more specialised reporting, our Power BI Consulting Services include an initial scoping conversation that identifies the specific dashboards and KPIs that will produce the highest value for the specific business.
Dashboards are designed for the person reading them, not for the data analyst who built them. A well-built Power BI dashboard is immediately readable by any member of the leadership team without training or explanation. If a dashboard requires a guide to interpret, it has not been designed for the right audience.
How Power BI Gets Its Data : Without the Technical Language
You may be wondering: if Power BI shows me information from my business systems, how does it get access to that information? The answer is straightforward, and it does not require you to change or replace any of your current systems.
Where the Data Comes From
Every business system you use, whether it is accounting software like Xero or QuickBooks, a CRM like HubSpot or Salesforce, an ERP like Dynamics 365 or Odoo, or even a well-organised spreadsheet stored in Microsoft OneDrive, holds data in a structured format that Power BI can read. The development service creates a connection between Power BI and each of your systems. Once the connection is established, Power BI reads the data from those systems automatically, at regular intervals, without any action required from you or your team.
What Connecting a Data Source Means in Practice
Connecting a data source simply means giving Power BI permission to read data from a specific system and telling it which data to read. Your accounting software holds transaction records, customer records, and financial summaries. The connection tells Power BI which of those records are needed for the dashboards being built. Your team continues using the accounting software exactly as before. Nothing changes in how your data is entered or stored. Power BI is reading the data, not changing it.
Why Data Quality Matters and What It Means If It Is Poor
Power BI shows you what your data says. If your data has errors in it, the dashboard will show those errors. If the same customer appears in your system under three different name variations, the dashboard will show their transactions split across three different customer entries rather than combined into one. If some invoices in your accounting system have not been categorised correctly, the revenue category breakdown on your finance dashboard will reflect those categorisation errors.
This is not a Power BI problem. It is a data quality problem that exists in the source system and becomes visible when the data is presented in a dashboard format. A good development service will identify data quality issues during the setup process and advise the business on how to address them, rather than building dashboards on top of known data problems.
How Often the Dashboard Updates
For most Dubai businesses, the dashboards update automatically every thirty minutes to four hours, depending on the setup. This means that when you open the dashboard after lunch, it reflects every transaction, every sales update, and every inventory movement that was recorded in your systems since the morning. For most business decisions, data that is a few hours old is just as useful as data that is updated every second. The development service selects the right update frequency for each type of data based on how current it needs to be for the decisions it supports.
What the Development Service Actually Does : Step by Step
This is what a Power BI dashboard development engagement looks like from your perspective as a business owner, in the sequence it happens.
Step 1: The Provider Learns About Your Business
The engagement begins with a structured conversation between the development team and the key people in your business who make decisions using data: typically the managing director, the finance director, and the heads of sales and operations. The team asks what information each person needs to make their best daily decisions, what reports they currently compile manually, what questions they ask the most often that take too long to answer, and what they wish they could see that they currently cannot. This conversation, which typically takes two to three hours across one or two sessions, produces a list of the specific metrics and information views the dashboards will show.
Step 2: The Provider Connects Your Data
The development team sets up the technical connections between Power BI and your business systems. This step happens in the background and does not require anything from you beyond providing the necessary access credentials to your systems. The team also audits the data in each connected system to identify any quality issues that would affect the accuracy of the dashboards. Where data quality issues are found, the team describes what they are, explains what impact they have on the dashboards, and recommends how to address them.
Step 3: The Provider Builds the Dashboards
Using the list of metrics and information views agreed in step one, and drawing from the connected data sources established in step two, the development team builds the dashboards. This step is almost entirely invisible to you. The team is doing technical work that produces the visual output. You do not need to be involved in this step beyond being available to answer occasional clarifying questions about how a specific metric should be calculated or what a particular business term means in your operational context.
Step 4: The Provider Shows You the Dashboards and Adjusts Them
When the dashboards are built, the team presents them to you and the other key stakeholders for review. This is where your input shapes the final product. You look at the dashboards and give feedback: this number does not look right, this chart would be more useful showing the last twelve months rather than the last six, this metric is missing, this one is not as important as I thought it would be. The team incorporates your feedback and presents the revised version. For most engagements, this review process runs through one or two cycles before the dashboards are finalised.
Step 5: Go-Live and Training
The finalised dashboards are published to the Microsoft Power BI platform, where they are accessible via a web browser on any device. Each person in your team who will use the dashboards receives a brief training session, typically thirty to sixty minutes, covering how to navigate the dashboards relevant to their role, how to apply filters and date ranges, and how to interpret each metric correctly. The development service remains available for questions and minor adjustments for a defined period after go-live.
For businesses whose data connections require integration with a custom ERP or a non-standard business platform, our ERP Integration Services ensure the data from those systems feeds into Power BI accurately and reliably from the first day of live use.
What to Expect After Go-Live
What the First Week of Using Dashboards Feels Like
The first week after go-live is the adjustment period. The dashboards are live and the numbers are accurate, but the team is still building the habit of checking them rather than defaulting to the old reporting methods. Some people will open the dashboard every morning and find it immediately useful. Others will continue reaching for the spreadsheet they know while the new dashboard feels unfamiliar. Both responses are normal. The habit forms over the first two to four weeks as the team builds confidence in the numbers they are seeing and develops a daily rhythm around checking them.
The most common question in the first week is not about the technology. It is about specific numbers: why does this figure not match what I see in the accounting system? The development service should be available to answer these questions quickly. Most of them have straightforward explanations, typically a difference in how a date range is applied or a difference in how a specific transaction category is counted in the two systems. Addressing these questions quickly in the first week builds the trust in the dashboards that drives sustained adoption.
What Ongoing Support Should Include
After the initial go-live support period, which typically runs two to four weeks, the development service should provide ongoing support that covers system changes affecting data connections, new dashboards or metrics requested as the business evolves, and performance issues if dashboard loading times become slow as data volumes grow. The right ongoing support model for a growing business is a defined monthly or quarterly arrangement rather than an ad-hoc arrangement billed by the hour. Predictable support costs make it easier to maintain the dashboard environment properly rather than deferring maintenance until problems become visible.
When You Will Know the Dashboards Are Working
The dashboards are working when the managing director's Monday morning routine no longer includes asking the finance manager for a weekly update, when the sales director stops compiling a pipeline report from individual team member inputs, and when the operations manager can answer a supplier question about stock levels without walking to the warehouse or calling the warehouse supervisor. These are small changes in daily behaviour that add up to significant time savings and significantly faster decision-making over the course of a month and a year.
Five Questions to Ask Any Provider Before You Start
You do not need technical knowledge to evaluate a Power BI development provider. These five questions, asked in plain language, reveal everything you need to know about whether a provider is the right choice for your business.
Can you show me a dashboard you built for a business similar to mine, and can I speak with that client?
Good answer: The provider shows you a specific example and offers a direct client conversation without conditions. The example business is comparable to yours in size, industry, or the type of data being displayed.
Walk away if: The provider shows you generic demo dashboards or case studies without offering a direct client conversation. This indicates either limited relevant delivery experience or a concern about what direct client conversations would reveal.
What happens if the numbers on the dashboard do not match what I see in my accounting system?
Good answer: The provider explains that number discrepancies are common in early stages, describes how they investigate and resolve them, and commits to a response time for this type of issue during the support period.
Walk away if: The provider says this does not happen with a properly built dashboard, or says you would need to log a support ticket and wait for a scheduled response. The first response is overconfident. The second indicates inadequate support availability during the critical early period.
How long will the development take and what do I need to provide during that time?
Good answer: The provider gives a realistic timeline of four to eight weeks for a standard implementation, describes specifically what they will need from you at each stage, and explains what happens if you are unavailable during a review session.
Walk away if: The provider gives a very short timeline without explaining how that accounts for data quality review, dashboard review cycles, and testing. A timeline that sounds too good may indicate a provider who is underestimating the work or planning to deliver something less thorough than the timeline implies.
What is included in the price, and what would cost extra?
Good answer: The provider lists specifically what the quoted price includes: the number of data source connections, the number of dashboards, the number of review cycles, the training sessions, and the post-go-live support period. They also describe clearly what falls outside the quoted scope.
Walk away if: The provider gives a vague all-inclusive description without specifying what is and is not covered. Vague scope descriptions consistently produce scope disputes and unexpected additional costs.
What do you need from me to get started, and how much of my time will this take?
Good answer: The provider describes the specific inputs they need from you: access credentials to your business systems, participation in one or two discovery conversations, availability for a dashboard review session, and participation in go-live training. The total time commitment for a business owner is typically four to eight hours across the full engagement.
Walk away if: The provider says they handle everything and need minimal involvement from you. This is a misrepresentation. A Power BI implementation that does not involve the business owner in defining what the dashboards should show produces dashboards that do not show what the business needs to see.
For businesses that want to start with a structured scoping conversation before committing to a full implementation, our Power BI Dashboard Development service begins every engagement with a discovery session that defines what the business needs to see before any development investment is committed.
The best Power BI provider for your business is not the one with the most impressive technical credentials. It is the one who listens most carefully to what information matters to how you run your business and builds dashboards that make exactly that information visible, accurately, every day.
You Do Not Need to Be a Data Expert to Benefit From Power BI
Power BI is not a tool for data analysts. It is a tool for business owners and leaders who want to see how their business is performing without waiting for someone to compile the information for them. The data expertise sits with the development service. Your expertise, which is how your business works and what information you need to run it well, is what makes the dashboards valuable.
Power BI dashboard development services in Dubai remove the barrier between the operational data your business already generates and the decisions that data should be informing every day. The development service builds the connection, builds the visual presentation, validates the accuracy, and trains the team. Your role is to describe what you need to see and to use what gets built.
The Monday morning when you open your laptop and can see exactly how the business is performing right now, without asking a single person for anything, is closer than most Dubai business owners expect when they start this conversation. It is typically six weeks away, for a business with accessible data and a clear sense of what information matters most.
Ready to see what a Power BI dashboard built specifically for your Dubai business would look like? Start the conversation with Digital Web Consulting through our Power BI Dashboard Development Services page
[power bi dashboard development services in Dubai , Power BI services Dubai , Power BI development company Dubai , Microsoft Power BI Dubai]