


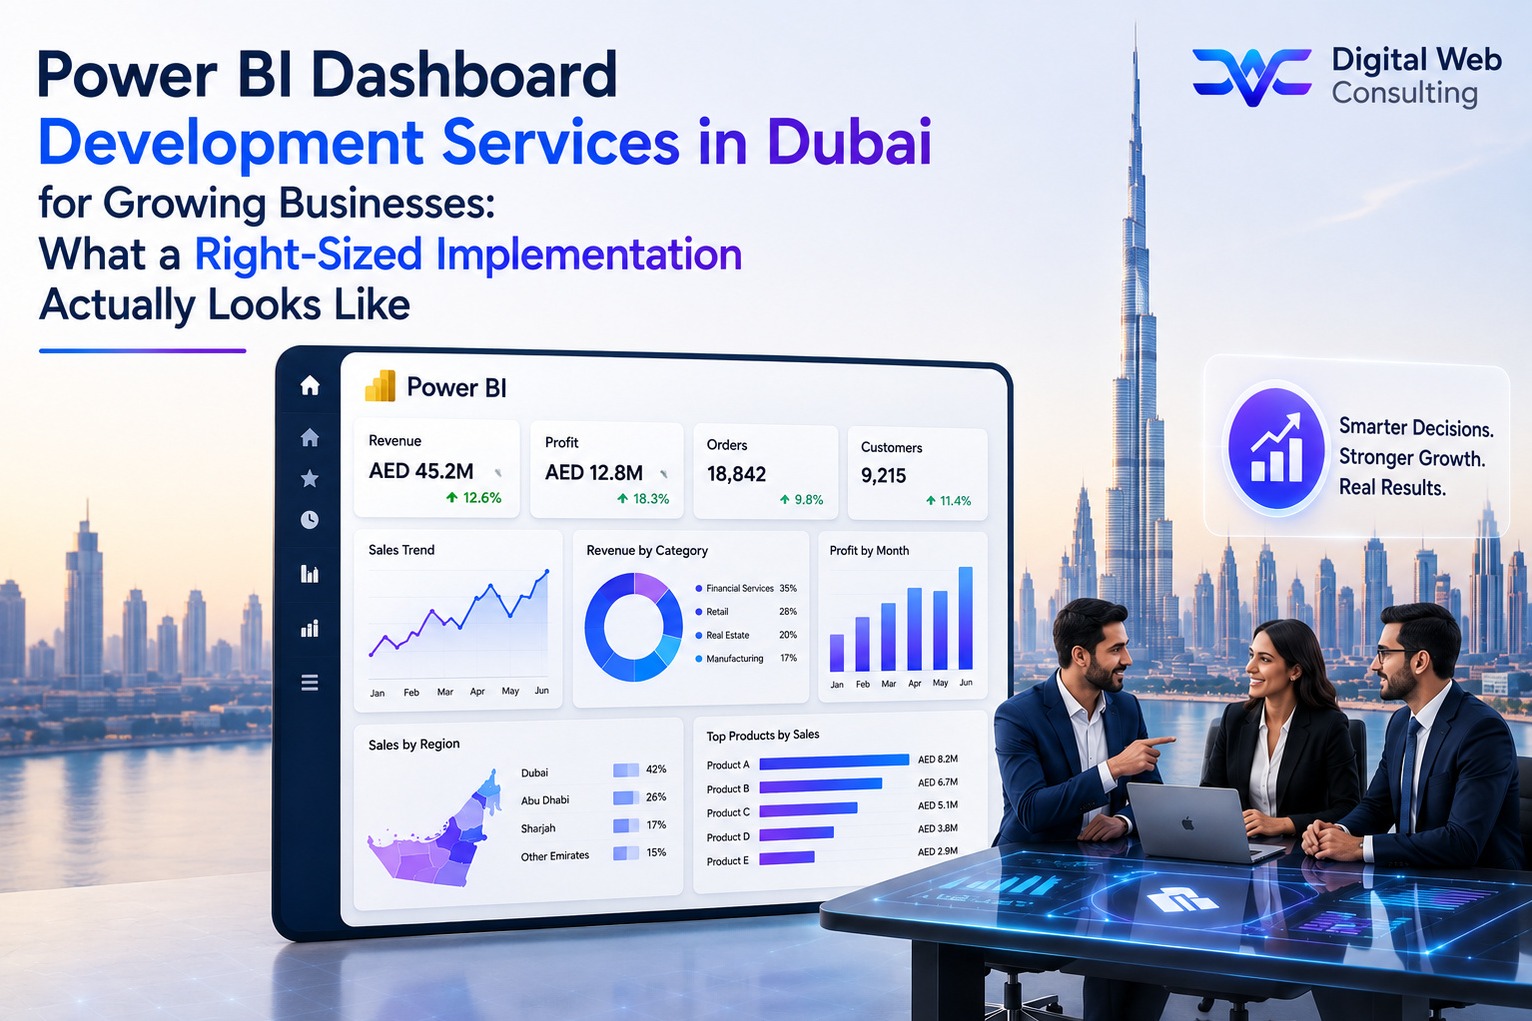
The Growing Business Assumption About Power BI
Ask a finance director at a forty-person Dubai business about Power BI and you will typically get one of two responses. Either they have heard of it but assumed it is for large enterprises with dedicated data teams, or they have looked at it briefly, seen complex-looking dashboards and enterprise case studies, and concluded that the implementation would overwhelm their organisation.
Both responses reflect an accurate observation about how Power BI has historically been marketed and implemented, but an inaccurate conclusion about whether it applies to businesses of their size. The platform has evolved significantly. The implementation approach for a growing business does not need to resemble an enterprise rollout. And the businesses in Dubai that are gaining the most immediate, measurable value from Power BI right now are often not the largest ones.
Power BI dashboard development services in Dubai for growing businesses look fundamentally different from enterprise implementations. They are narrower in scope, faster to deliver, lower in cost, and designed to produce visible, trusted results in six weeks rather than six months. This guide explains specifically what that right-sized approach involves, what it produces, and how a growing Dubai business knows whether it is ready to start.
The most common reason growing businesses delay a Power BI implementation is the assumption that they need to wait until they are larger or better organised. In practice, businesses of twenty to two hundred employees consistently produce the fastest return on Power BI investment because the gap between what they can currently see and what Power BI makes visible is the widest.
This guide is written for Dubai businesses with annual revenues between AED 5 million and AED 150 million, team sizes between twenty and two hundred employees, and technology stacks that include at least one accounting platform and one operational system generating data the business is not yet fully using.
What Right-Sized Actually Means in Power BI Dashboard Development
Right-sized is not a compromise. It is a deliberate design choice that produces a Power BI environment the growing business can actually use, trust, and build on. Four dimensions define what right-sized looks like in practice for a Dubai business at this stage of growth.
Scope Discipline
A right-sized Power BI implementation connects two to four data sources rather than attempting to connect every system the business runs simultaneously. For most growing Dubai businesses, the highest-value sources are the accounting platform, the CRM or sales tracking system, and the inventory or operations platform. Connecting these three produces more immediately useful insight than connecting ten sources with less focus on what each one needs to answer.
Scope discipline is not about what the platform cannot do. It is about what the business is ready to use. A growing team that has never had live dashboards does not need seventeen data sources and forty KPIs on day one. They need five to eight metrics they trust, that they check every morning, and that change how they make decisions every week.
KPI Focus
Enterprise Power BI implementations often attempt to build comprehensive analytics suites covering every metric the organisation tracks. For a growing business, this approach produces dashboards that are impressive to look at and rarely checked after the first week. A right-sized implementation identifies the five to eight metrics that the business's leadership actually uses to make decisions, builds dashboards that answer those specific questions clearly, and defers the broader analytics build to a later phase when the team has built the habit of using live data.
Timeline
A right-sized Power BI implementation for a growing Dubai business is deliverable in four to six weeks from kickoff to go-live. This is not a shortened version of a longer project. It is a purpose-built scope that fits the data environment and KPI requirements of a business at this stage. The four-to-six-week timeline is achievable because the scope is defined clearly from the start, the data sources are limited, and the dashboard design is built around a specific KPI list rather than an open-ended reporting brief.
Budget
A right-sized Power BI implementation for a Dubai growing business typically falls in the range of AED 15,000 to AED 45,000 for the initial development engagement, depending on the number of data sources, the complexity of the data model required, and the number of dashboards built. This is significantly lower than enterprise implementations not because the quality is lower, but because the scope is deliberately matched to what the business actually needs rather than what the platform is technically capable of.
For growing businesses that have already established their core data infrastructure but are ready to extend their analytical capability, our Power BI Consulting Services service covers the advisory layer that ensures the implementation scope is correctly matched to the business's data maturity and growth trajectory before any development work begins.
Right-sized does not mean permanently limited. The data model built in a right-sized implementation is designed to accommodate additional data sources and dashboard requirements as the business grows. The scope starts narrow. The architecture starts scalable.
The Three Most Valuable Dashboards for a Growing Dubai Business
For most growing Dubai businesses, three dashboards cover the majority of the decisions leadership makes on a daily and weekly basis. These are the starting points that consistently produce the fastest return on a Power BI development investment.
Financial Performance Dashboard
The financial performance dashboard gives leadership a live view of the metrics that determine whether the business is operating profitably and with adequate liquidity. For a growing Dubai business, the core metrics are revenue against target for the current period, gross margin by product line or service category, operating cost breakdown against budget, cash position updated daily as payments are received and made, and accounts receivable aging showing outstanding invoices by age band.
Without Power BI, this picture is typically available only after a monthly finance close that takes two to five days to complete. The business makes daily operational decisions without knowing whether it is tracking ahead of or behind its financial targets. With a live financial dashboard, the finance director and the managing director have the same current picture every morning without anyone spending time compiling it.
Sales Pipeline and Revenue Dashboard
The sales pipeline dashboard connects CRM data to financial data to give a unified view of current and forecast revenue. For a growing Dubai business, the most valuable metrics are total pipeline value by stage, weighted forecast for the current quarter, deals at risk by age and by last activity date, conversion rate by source and by sales team member, and average deal cycle time against the business's target.
The value of this dashboard is not in the individual metrics. It is in the ability to see, in one place, whether the business will meet its revenue targets for the quarter based on the current pipeline state. A managing director who can answer that question in two minutes rather than two days makes better resource allocation decisions and surfaces problems earlier.
Operations and Fulfilment Dashboard
The operations dashboard connects inventory, order management, and delivery data to give the operations team and leadership visibility into how effectively the business is fulfilling its commitments to customers. The core metrics depend on the industry, but for most Dubai trading and services businesses they include: order fulfilment rate, average delivery or project completion time against target, stock levels against reorder thresholds, supplier on-time performance, and open service requests or complaints by age.
For businesses in logistics, trading, or manufacturing where operational performance is a primary competitive differentiator, this dashboard often produces the most immediate ROI because the decisions it informs happen multiple times daily. Our ERP Integration Services ensure the operational data feeding this dashboard comes from a connected, accurate source system rather than from manual exports that introduce lag and error.
Starting with three dashboards does not mean the Power BI environment stays at three dashboards. It means the first three are built well, adopted fully, and trusted before the scope expands. A business with three dashboards that leadership checks every day is in a better position than a business with fifteen dashboards that nobody fully understands.
The Data Sources a Growing Dubai Business Typically Connects First
The sequence in which data sources are connected matters as much as which sources are connected. For a growing Dubai business, the right connection sequence is almost always the same: start with the source that holds the most trusted, most complete, and most frequently referenced data, and build outward from there.
Accounting Platform
• Xero: The most common accounting platform among Dubai SMEs and one of the most straightforward Power BI connections. Xero's API provides access to profit and loss data, balance sheet information, invoice records, and cash flow data in a structured format that maps cleanly into a Power BI data model.
• QuickBooks: Similarly accessible via API and widely used among Dubai growing businesses, particularly those with international parent companies. The connection is well-supported and the data structure is consistent enough for reliable financial dashboards.
• Zoho Books: Popular among Dubai businesses already running other Zoho products. Integrates well with Power BI and shares data structures with Zoho CRM, making the combined financial and sales dashboard particularly clean to build when both platforms are in use.
The accounting platform should be connected first because financial data is the most universally referenced across every dashboard and the most frequently used by senior leadership. Once the financial data model is validated, every subsequent dashboard builds on a trusted financial foundation.
CRM Platform
The CRM connection brings sales pipeline and customer data into the Power BI environment. For businesses using HubSpot, Zoho CRM, or a custom-built CRM, the connection approach differs technically but the outcome is the same: deal stages, contact records, activity history, and revenue attribution data are available in the data model for the sales dashboard.
One UAE-specific consideration in the CRM connection: many Dubai businesses manage a significant volume of customer communication through WhatsApp Business rather than through the CRM directly. Where this is the case, the Power BI data model should account for the gap between CRM-recorded interactions and the full customer communication picture, rather than presenting CRM engagement data as a complete representation of customer relationship health.
ERP or Inventory System
The ERP or inventory system connection brings operational data into the model. For businesses running a standard ERP, the connection is via API or direct database query, depending on the platform and the hosting arrangement. For businesses still managing inventory in spreadsheets, the Power BI connection uses spreadsheet import with a structured template that standardises the data format and enables reliable refresh.
Spreadsheets as a Transitional Source
Many growing Dubai businesses hold important operational data in spreadsheets because the relevant system integration does not yet exist. Power BI can connect to well-structured spreadsheets held in SharePoint or OneDrive with automatic refresh, making spreadsheet data available in dashboards without requiring a full system migration as a prerequisite. This transitional approach allows the Power BI environment to go live on the available data while the underlying system infrastructure is improved in parallel.
The decision about what to connect and in what order should be made during the discovery stage of the implementation, not at the point of database design. A Power BI provider that does not conduct a structured data source discovery before beginning development is making connection and model decisions without the information needed to make them well.
What a Right-Sized Power BI Implementation Looks Like Week by Week
Four to six weeks is the realistic and achievable delivery timeline for a right-sized Power BI implementation for a growing Dubai business. Here is what each phase of that timeline involves.
Weeks One and Two : Discovery and Data Audi
The first two weeks establish the foundation for everything that follows. The provider conducts stakeholder interviews with the finance director, the managing director, and the heads of sales and operations to identify the specific questions each role needs answered from its data. Not general reporting requirements. The specific decisions made every week where better data visibility would change the quality or speed of that decision.
Simultaneously, every data source is audited. Connection method, data quality, update frequency, field naming conventions, and known data anomalies are all documented. UAE-specific data considerations are identified: VAT calculation fields, multi-currency transaction records, Arabic text fields that need handling in dashboard filters, and WPS payroll data where it feeds HR reporting.
The output of the discovery phase is a confirmed KPI list and a data source map that both the business and the provider sign off before any development begins. This sign-off is the most important quality control moment in the entire engagement. Every subsequent stage is a technical execution of what the discovery phase defined.
Weeks Two and Three : Data Model Build
The data model connects the confirmed sources, transforms raw operational data into the analytical structure the dashboards require, and establishes the calculation logic for every KPI in the confirmed list. UAE-specific transformation work happens here: multi-currency normalisation to AED, VAT data structuring for FTA-compliant reporting views, and Arabic text field handling for bilingual dashboard filters.
The data model is validated against known correct values from the source systems before dashboard design begins. A financial figure in Power BI that does not match the same figure in the accounting platform is a data model problem, not a display problem, and it is significantly less expensive to correct at this stage than after the dashboards are built around it.
Weeks Three and Four : Dashboard Design and Review
Dashboards are built for each user group based on the confirmed KPI list. A first version is shared with the relevant stakeholders for review. For a growing business, the review process should be straightforward: does this dashboard answer the questions identified in discovery? Are the numbers accurate? Are the filters and date selections working as expected? Is the layout clear enough that the right insight is visible without explanation?
One review cycle is typically sufficient for a right-sized implementation with a well-defined KPI list. Where multiple review cycles are needed, it is usually because the KPI list was not defined precisely enough during discovery. This is the most common cause of right-sized implementations running beyond the four-to-six-week target.
Weeks Five and Six : Testing, Training, and Go-Live
Each dashboard is validated against real business data for the most recent completed period, confirming that every metric matches its source system equivalent. Role-based access is configured and tested. Each user group receives a thirty-to-sixty-minute training session covering the dashboards relevant to their role: how to navigate, how to apply filters, how to read the visualisations, and how to interpret the metrics in the context of their daily decisions.
Go-live is phased by user group rather than all at once. Leadership dashboards go live first, followed by department-level dashboards as the team is trained. A two-week post-go-live support period addresses questions that emerge when users engage with live data for the first time and makes minor adjustments to layout or filter logic based on actual usage patterns.
For businesses whose go-live needs to align with a broader technology transition rather than happening independently, our IT Consulting Services provide the programme coordination that sequences the Power BI implementation correctly within the larger technology change.
How to Know If Your Dubai Business Is Ready for Power BI Dashboard Services
Readiness for a Power BI implementation is not about business size or revenue level. It is about data availability and decision-making context. These signals indicate where a growing Dubai business sits on the readiness spectrum.
Signs Your Business Is Ready to Start Now
• You are running at least one accounting platform and one operational system that holds meaningful data: The minimum data foundation for a useful right-sized implementation is one financial data source and one operational data source. If both exist and are updated regularly, the data foundation is sufficient.
• Your key financial and operational metrics currently take more than one day to compile: If answering a basic management question requires someone to extract data, combine it manually, and format it into a report, Power BI is ready to replace that process today.
• Leadership is making decisions without a real-time view of performance: If the most current picture of the business's financial position, pipeline status, or operational performance is always at least several days old, the decision-making environment is information-constrained in ways Power BI directly addresses.
• You have a clear sense of the five to eight metrics that matter most to how you run the business: Businesses that can articulate their key metrics clearly produce faster, more successful Power BI implementations than those whose KPI definition is still vague. If you know what you need to see, the implementation can be designed to show it.
• A senior stakeholder is available to participate in the discovery and review process: Power BI implementations that lack active senior stakeholder involvement during discovery and review produce dashboards that reflect what the provider assumed the business needed. Active involvement produces dashboards that reflect what the business actually uses to manage performance.
Signs You Need Foundational Work First
• Your primary operational data lives in spreadsheets with no consistent structure: Power BI can connect to spreadsheets, but unstructured spreadsheet data with inconsistent formatting, merged cells, and variable column names produces unreliable dashboards. A data structure review before implementation produces significantly better results.
• Your accounting records have known accuracy problems: Dashboards built on inaccurate source data display inaccurate metrics. If the business knows its accounting records have gaps, categorisation inconsistencies, or unreconciled items, addressing these before the Power BI implementation ensures the dashboards produced are trusted from day one rather than immediately questioned.
• Nobody in the business currently reviews any form of management reporting regularly: Power BI is most effective in businesses where leadership has an established habit of reviewing performance data, even if that data currently arrives too slowly or too manually. In businesses where no reporting habit exists, the implementation itself is unlikely to create one. Establishing the reporting habit first produces a much stronger foundation for Power BI adoption.
For businesses in the foundational work phase, our Digital Transformation Consulting service covers the data infrastructure and process standardisation work that creates the conditions for a successful Power BI implementation, so the development investment delivers the return it should rather than producing dashboards the business is not yet ready to trust.
Readiness is a preparation target, not a fixed state. Every growing business that is not yet ready for Power BI can become ready. The question is whether that preparation happens before the implementation, when it costs time but not money, or during the implementation, when it costs both.
Right-Sized Is Not a Compromise
The assumption that growing businesses should wait until they are larger before investing in business intelligence is costing Dubai companies months of better decision-making, earlier problem identification, and the operational visibility that separates businesses that manage their growth from those that are managed by it.
Power BI dashboard development services in Dubai for growing businesses are not a scaled-down version of enterprise analytics. They are a purpose-built approach that matches scope to data maturity, connects the highest-value sources first, builds the three dashboards that change how leadership runs the business daily, and delivers within six weeks rather than six months. The return is real, the timeline is realistic, and the investment is proportionate to the size of the business making it.
A growing Dubai business with twenty to two hundred employees, a functioning accounting platform, and a clear sense of the metrics that matter is ready to start. The right implementation does not require the business to grow into it. It is designed for exactly where the business is right now.
Right-sized Power BI is not where growing businesses start before moving to real business intelligence. It is real business intelligence, built for where the business actually is, delivering visible value from week six onward and scaling as the business grows into a broader analytical capability.
Ready to discuss what a right-sized Power BI implementation looks like for your Dubai business specifically? Start the conversation with Digital Web Consulting through our Power BI Dashboard Development Services page
[power bi dashboard development services in Dubai , Power BI services Dubai , Power BI development company Dubai , Microsoft Power BI Dubai , Power BI for growing business Dubai , right-sized Power BI implementation UAE , affordable Power BI dashboard Dubai]