


The Reporting Problem Most UAE Businesses Have Normalised
Every Monday morning, someone in the finance team opens a spreadsheet and starts pulling numbers from the ERP. Someone in sales updates a pipeline tracker. Someone in operations compiles a stock summary. By Wednesday, the numbers are assembled. By Thursday, the report reaches leadership. By Friday, when decisions get made, the data is already five days old.
This cycle repeats every week. Nobody questions it because it has always worked this way. But the cost of it, in staff time, in decision lag, in opportunities missed because the data arrived too late, accumulates silently in the background of every business that runs reporting manually.
The problem is not effort. The problem is architecture. The business's data lives in multiple disconnected systems, and producing a consolidated view of it requires someone to manually extract, combine, and format information that Power BI consulting in UAE can make available automatically, in real time, to every person who needs it.
11 hours the average amount of time finance professionals spend per week on manual data gathering and report production that business intelligence tools could automate, Gartner Finance Analytics Survey, 2024
“ The weekly report cycle is not a reporting solution. It is a workaround for the absence of one, and every business that has normalised it is paying for live data in staff time while still making decisions from outdated information. ”
The shift from manual reporting to live dashboards is not a technology upgrade. It is an operational one, and for most UAE businesses, the return on that shift is visible within the first month of deployment.
What Power BI Consulting Actually Is: Beyond the Software
Microsoft Power BI is a data visualisation platform. It connects to data sources, transforms data, and presents it through interactive dashboards and reports. It is powerful software, and on its own, it is not enough.
The gap between purchasing a Power BI licence and having live, accurate, role-specific dashboards that your leadership team actually trusts is filled by Power BI consulting. That gap involves data source architecture, data model design, transformation logic, dashboard design built around real KPIs, access control configuration, and adoption support. None of these come with the licence.
Here is what distinguishes a Power BI consulting engagement from simply buying the software and attempting to configure it internally:
- Data architecture expertise: A consultant maps every data source the business uses, ERP, CRM, accounting platform, spreadsheets, external feeds, and designs a connection architecture that pulls the right data, in the right format, at the right frequency, without creating performance problems or data conflicts.
- Data model design: Raw data from operational systems is rarely in the structure Power BI needs to produce accurate reports. A consultant designs the transformation logic that converts operational data into a clean, consistent analytical model, handling currency conversions, date hierarchies, VAT calculations, and multi-entity consolidation correctly from the start.
- KPI alignment: A consultant works with leadership to identify the specific metrics that drive decision-making in this business, not the default metrics Power BI demos show, but the numbers your finance director, sales manager, and operations lead actually use to manage performance.
- Adoption planning: A dashboard that no one checks is not a business intelligence solution. A consultant designs the distribution model, who sees what, how dashboards are accessed, how alerts are configured, so that the data reaches the people who need it in the format they will actually use.
For businesses whose Power BI implementation needs to connect directly to a custom ERP or CRM, our ERP Integration Services and CRM Integration Services ensure that the data flowing into Power BI is accurate, complete, and structured for reliable analytics from day one.
The software does the visualisation. The consulting does everything that makes the visualisation trustworthy, and trustworthiness is the only thing that determines whether dashboards get used or ignored.
The Five Deliverables of a Well-Run Power BI Consulting Engagement
A Power BI implementation in UAE delivered properly produces five concrete outputs that transform how the business accesses and uses its operational data:
- Data source audit and connection architecture: A complete map of every data source the business holds, an assessment of data quality and accessibility in each, and a designed connection architecture that defines how each source feeds into the Power BI environment. This document becomes the technical blueprint for everything that follows and the maintenance reference for every future change.
- Data model design and transformation logic: The analytical data model that sits between raw operational data and the dashboards the business sees. This model handles all the transformation work, combining data from multiple sources, calculating derived metrics, managing date intelligence for period comparisons, and applying the business rules that make the numbers accurate rather than just present.
- Dashboard design built around actual KPIs: Interactive dashboards designed for each user group, finance, sales, operations, HR, executive, showing the specific metrics relevant to each role, with filters, drill-downs, and period comparisons that allow users to explore the data without needing to request a new report. Every visual element is deliberately chosen to answer a question the user actually asks.
- Role-based access and distribution setup: Configuration of who sees what data, at what level of detail, through which access channel, whether that is the Power BI web interface, the mobile app, embedded dashboards in existing business tools, or automated email delivery of specific reports. The access model ensures sensitive data reaches the right people and no others.
- Training and adoption support: Role-specific training that teaches each user group how to navigate the dashboards relevant to their function, how to use filters and drill-downs, how to interpret the metrics correctly, and how to request changes as their analytical needs evolve. Adoption support in the weeks following go-live addresses the questions that emerge when users engage with live data for the first time.
Each of the five deliverables above builds on the previous one. The data model cannot be designed without the source audit. The dashboards cannot be designed without the KPI alignment. The adoption support cannot be planned without knowing who uses what. The sequence matters as much as each individual step.
What Power BI Dashboards Look Like Across UAE Business Functions
The practical impact of Power BI for UAE businesses is best understood through what each department actually sees once the dashboards are live. Here is what that looks like across five core business functions:
- Finance
Live metrics: Live profit and loss by entity and cost centre, real-time cash position against credit facilities, VAT liability updated with every transaction, accounts receivable aging with collection probability scoring, and budget vs. actual variance with automatic period comparison, all visible without waiting for the monthly close.
- Sales
Live metrics: Pipeline value by stage and sales rep, conversion rate by lead source and deal type, average deal cycle time against target, monthly revenue against quota with trend projection, and customer acquisition cost by channel, updated in real time as the CRM is used rather than compiled at the end of the month.
- Operations
Live metrics: Stock levels by SKU and warehouse location updated as movements are recorded, supplier on-time delivery rate by vendor, order fulfilment rate and average fulfilment time, back-order value and estimated clearance timeline, and landed cost per unit by product category, giving operations management a live operational picture without calling the warehouse.
- Human Resources
Live metrics: Headcount by department and location, monthly payroll cost against budget with variance analysis, leave balance summary across the team, WPS compliance status by payroll period, and employee tenure distribution, giving HR and finance a shared view of workforce cost without manual reconciliation between systems.
- Executive
Live metrics: A single cross-functional summary dashboard showing the five to eight metrics the leadership team uses to assess business health, revenue against target, gross margin trend, cash position, pipeline coverage ratio, fulfilment rate, and headcount cost as a percentage of revenue, with drill-down to department detail for any metric that warrants further investigation.
For businesses that want to extend Power BI beyond internal reporting to include customer-facing analytics or embedded dashboards within their own software products, our Power BI Dashboard Development service covers the full scope of custom dashboard development including embedded analytics within ERP and CRM platforms.
The most valuable dashboards are not the most visually complex ones. They are the ones that answer the specific questions leadership asks most frequently, making those answers available in seconds rather than days.
The Timeline Question: How Long Before Dashboards Go Live?
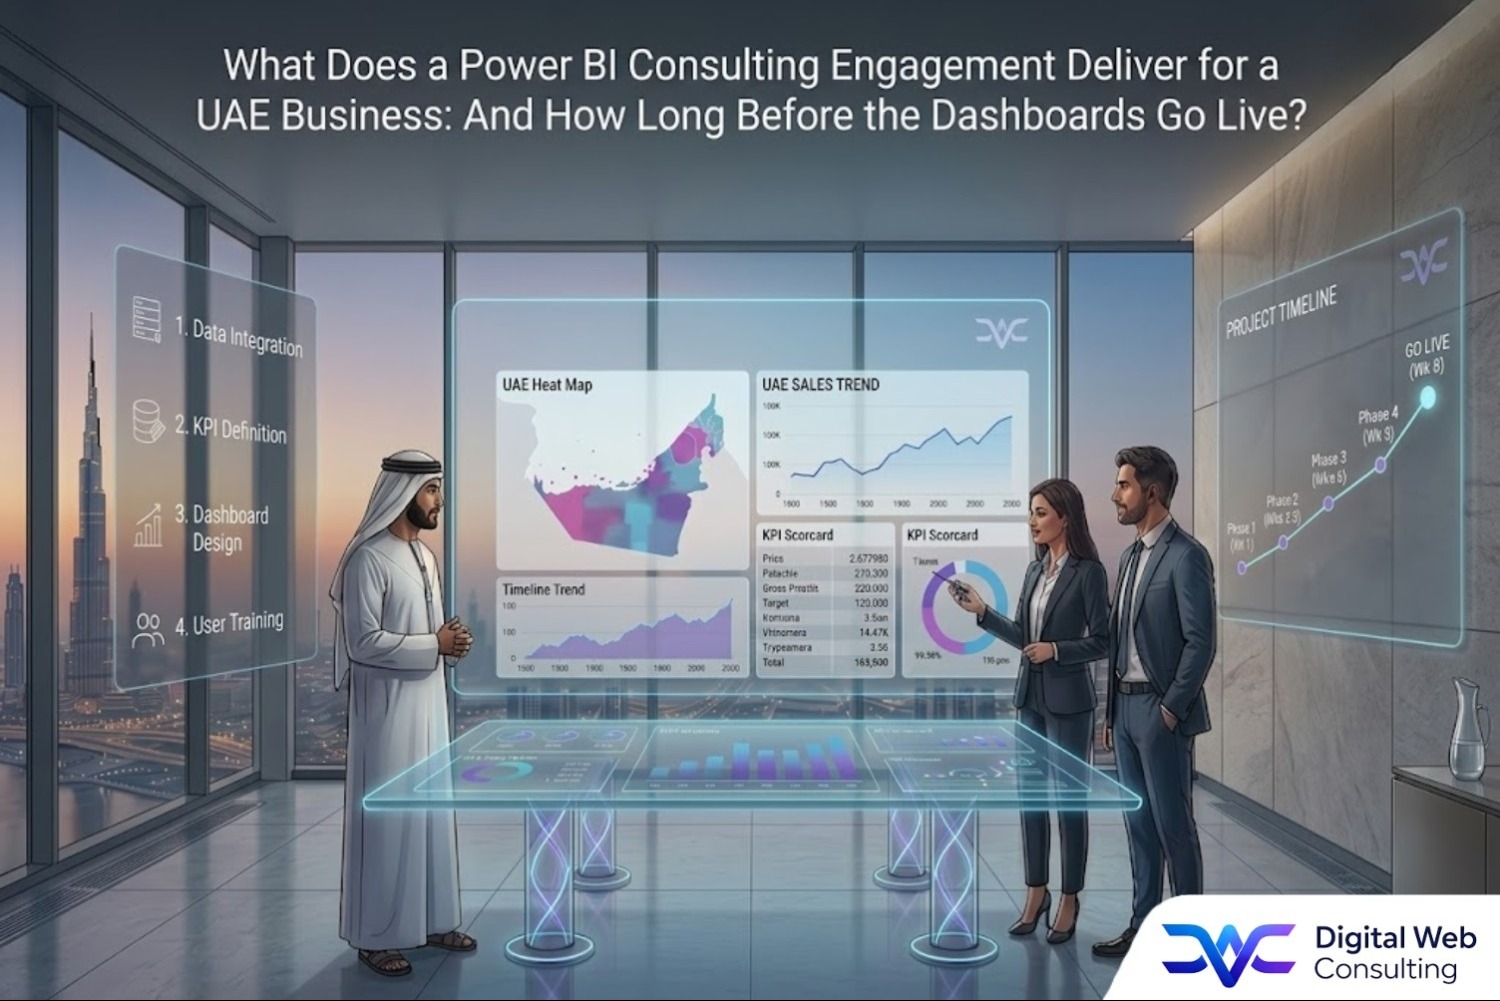
This is the question every business asks before committing to a Power BI consulting engagement, and the honest answer is eight weeks for a well-scoped, focused implementation. Here is what happens in each phase:
Phase 1 - Weeks 1 to 2: Discovery and Data Audit
The consulting team conducts stakeholder interviews with finance, sales, operations, and HR leads to identify the specific KPIs and reporting questions each function needs answered. Simultaneously, every data source is audited, connection method, data quality, update frequency, and structure. The output of this phase is a confirmed KPI list and a data source map that informs everything that follows.
Phase 2 - Weeks 3 to 5: Data Model and Transformation Build
The analytical data model is built, tested, and validated against real business data. This is the most technically intensive phase and the one most hidden from business stakeholders, but it is also the phase that determines whether the numbers in the dashboards are accurate and trustworthy. Each data connection is validated, each transformation rule is tested against known outcomes, and the model is reviewed by the finance or operations lead responsible for each data domain.
Phase 3 - Weeks 6 to 7: Dashboard Design and Business Review
Dashboards are designed for each user group based on the confirmed KPI list. A first version is shared with the relevant stakeholders for review, layout, metric selection, visual type, and filter logic are adjusted based on feedback before finalisation. This iterative review cycle is what produces dashboards that get used rather than ignored.
Phase 4 - Week 8: Testing, Training, and Go-Live
Final data validation confirms the dashboards are showing accurate, current figures across all connected data sources. Role-specific training sessions are delivered to each user group. Access is provisioned, distribution is configured, and the dashboards go live. A two-week hypercare period follows where the consulting team is available to address questions and make refinements as users engage with live data.
Two factors most commonly extend this timeline beyond eight weeks: data quality issues discovered during the audit phase that require source system remediation before the data can be modelled accurately, and incomplete access to source systems that delays the connection and transformation work in phase two. Both are addressable, but both take time, and neither can be rushed without compromising the accuracy of the output.
For businesses whose data is currently spread across multiple disconnected systems without a clean integration layer, our IT Consulting Services can help establish the data infrastructure foundations that make a Power BI implementation faster, cleaner, and more reliable from the start.
Eight weeks from kickoff to live dashboards is achievable for most UAE businesses with good data accessibility. The businesses that go live fastest are the ones that bring their key stakeholders into the KPI definition process early and make source system access available from day one.
The ROI of Power BI Consulting for UAE Businesses
The Power BI ROI for UAE businesses shows up across three value streams, and the combination of them makes the return on a well-delivered implementation significantly higher than most businesses expect before they start:
- Report production time eliminated: The most immediate and measurable return. A finance team spending eleven hours per week on manual report production, a conservative figure for a business with multiple data sources and regular management reporting requirements, recovers over five hundred hours of productive capacity in the first year alone. At any reasonable labour cost, that single saving covers a significant portion of the implementation investment.
- Decision speed and quality improvement: Decisions made from live data rather than week-old reports are made faster and from a more accurate information base. For businesses where timing matters, stock replenishment, credit decisions, sales pipeline management, the improvement in decision quality compounds over every cycle. This return is harder to quantify precisely but is consistently cited by UAE business leaders as the most significant operational improvement from Power BI deployment.
- Compounding return as data sources expand: A Power BI implementation built on a well-designed data model scales incrementally. Adding a new data source, a new system, a new business unit, a new external data feed, takes days rather than weeks once the foundation is in place. Each addition multiplies the analytical value of the existing dashboards without requiring a new implementation project.
- Reduced dependency on specialist reporting staff: Businesses that previously relied on a dedicated analyst or senior finance team member to produce management reports find that Power BI redistributes that capability across the leadership team, giving everyone direct access to the data they need without routing requests through a central reporting function.
- Improved audit and compliance readiness: For UAE businesses subject to VAT audits, financial statement reviews, or regulatory reporting requirements, dashboards that draw directly from source system data with full traceability reduce the time and effort required for compliance reporting, and reduce the risk of discrepancies between reported figures and underlying records.
“ The ROI of Power BI consulting is not theoretical. It shows up in the first payroll cycle after go-live when the finance team does not spend three days building the management pack, and it compounds every month from that point forward. ”
The businesses that underestimate Power BI ROI are the ones that measure only the report production time saving. The businesses that get the most from it are the ones that measure decision speed, decision quality, and the strategic value of having every leader working from the same live data simultaneously.
Live Data Is Not a Luxury: It Is a Decision-Making Standard
The gap between a business that makes decisions from last week's report and one that makes them from this morning's dashboard is not a technology gap. It is a competitive one. In a market as fast-moving as the UAE, the businesses that see their operational position in real time respond faster, allocate resources better, and catch problems earlier than those still waiting for the weekly pack.
Power BI consulting services in UAE deliver that real-time visibility, not by replacing the business's existing systems, but by connecting them into a unified analytical layer that makes the data they already generate visible, accurate, and actionable in the hands of the people who need it most.
The engagement takes eight weeks. The return begins in the first month. And the value compounds every month after that as the data accumulates, the dashboards evolve, and the leadership team builds the habit of running the business from live information rather than historical summaries.
“ Every business already has the data it needs to make better decisions. Power BI consulting is what makes that data visible, and visibility is what turns data into decisions and decisions into results. ”
Ready to move from weekly reports to live dashboards? Explore what a Power BI consulting engagement looks like for your business through Digital Web Consulting's Power BI Consulting Services page →
[Power BI consulting services UAE , Power BI implementation UAE , Microsoft Power BI Dubai , Power BI advisory UAE , Power BI consulting for finance teams Dubai , how Power BI helps UAE businesses , Power BI ROI UAE ]