

Why Industry Context Changes Everything in Power BI Development
A generic Power BI dashboard is better than no dashboard. It gives the business some visibility into data that was previously inaccessible or manually compiled. But a generic dashboard, built from a template rather than from a deep understanding of how a specific industry operates, consistently produces one of two outcomes: a dashboard that is used for the first week and then quietly abandoned because it does not answer the questions the business actually asks every day, or a dashboard that gets used but produces the wrong answers because the data model was not designed for the operational logic of the industry.
Trading companies in Dubai do not have the same reporting needs as logistics companies. Logistics companies do not have the same data architecture as real estate developers. The KPIs that determine business performance in each sector are different. The data sources that feed those KPIs are different. The UAE-specific regulatory and operational requirements that affect how data is structured are different. And the decisions that leaders in each industry make daily, the decisions that good dashboards are supposed to support, are different.
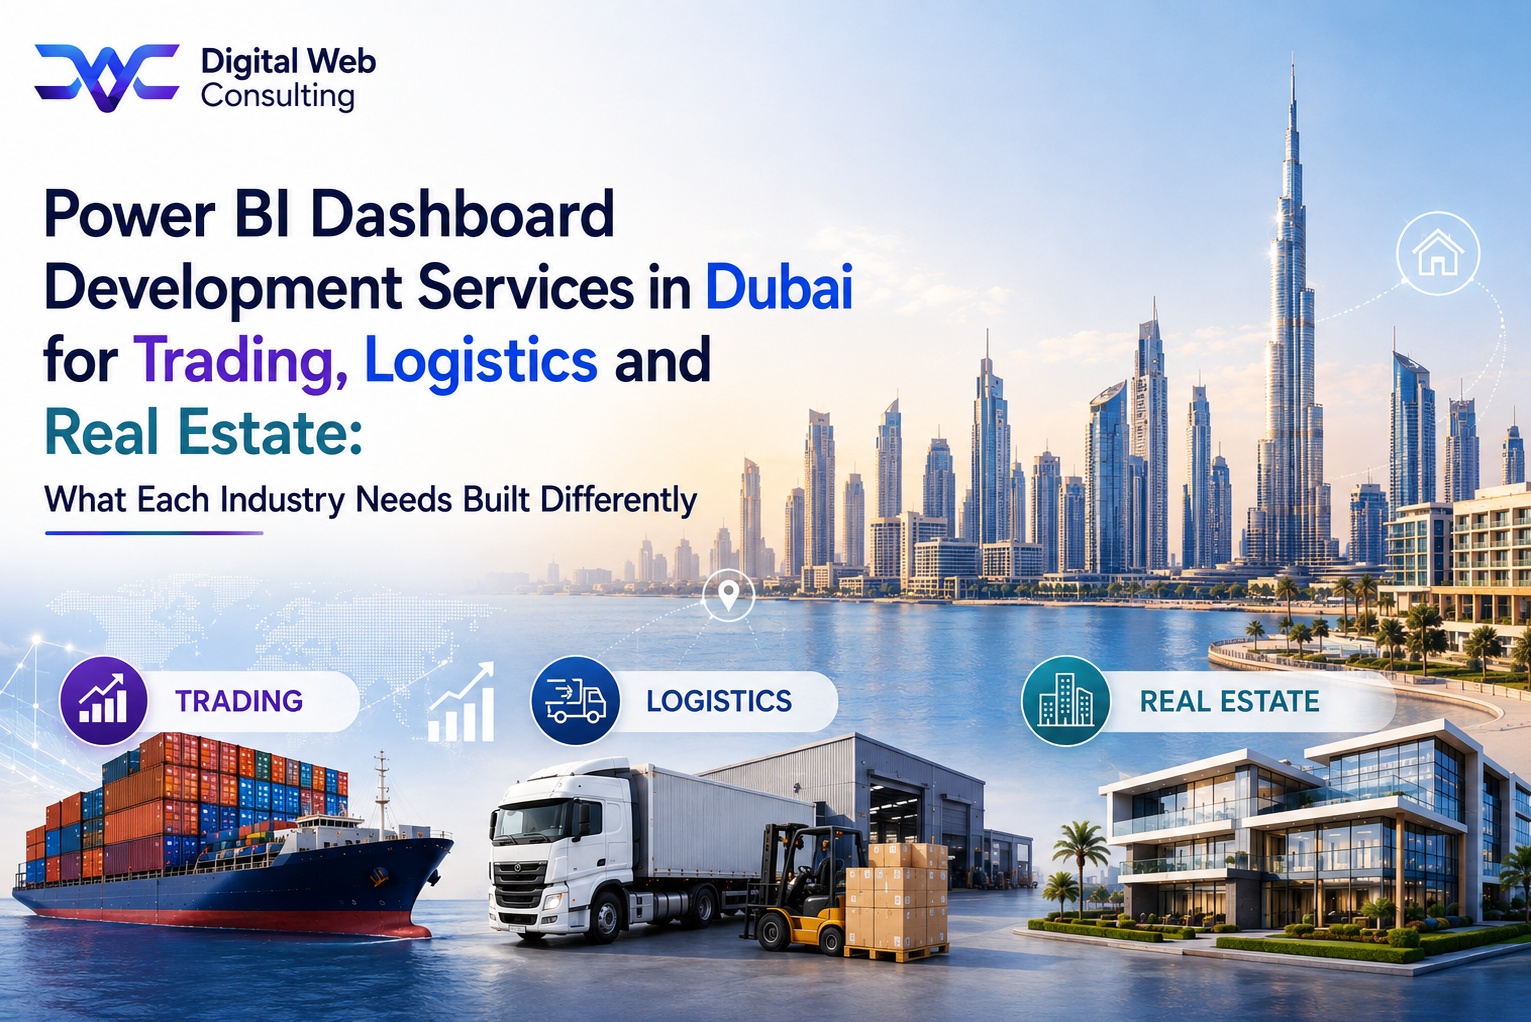
Power BI dashboard development services in Dubai that understand this produce industry-specific implementations built around how each sector's businesses actually run. This guide describes what that looks like for three of Dubai's most significant industry sectors: trading and distribution, logistics and freight, and real estate development.
The most common reason Power BI implementations disappoint is not the platform. It is the data model. And the most common reason the data model underperforms is that it was designed for a generic business rather than for the specific operational logic of the industry the business operates in.
Each industry section in this guide covers the specific KPIs, data sources, dashboard structure, and UAE-specific considerations that distinguish a well-built implementation for that sector from a generic one. If your business operates in one of these three industries, the relevant section gives you a clear picture of what a right-built Power BI implementation looks like for your operational context.
Power BI for Dubai Trading Companies
The Operational Challenges Power BI Solves in Trading
Dubai trading companies operate across multiple currencies, multiple supplier relationships, multiple product categories, and often multiple legal entities. The financial picture of a trading business at any given moment involves purchase orders in transit, letters of credit in various stages, inventory valued in different currencies, and receivables across a customer base that may span dozens of countries. The combination of this complexity with the speed at which trading margins move makes real-time visibility not a luxury but an operational necessity.
Without Power BI, the finance director of a Dubai trading company typically knows the business's financial position at the end of last month, not today. Purchasing decisions are made without a current picture of inventory cover. Margin analysis is done retrospectively rather than on active deals. Customer credit exposure is calculated manually when a new order arrives rather than visible in real time. Power BI addresses every one of these gaps when it is built correctly for a trading environment.
Key KPIs for a Dubai Trading Company Power BI Implementation
• Gross margin by product category and supplier: Trading margins vary significantly by product line and by supplier relationship. A dashboard that shows gross margin at the business level without breaking it down by category and supplier obscures the information that drives purchasing and pricing decisions. The data model needs to connect sales revenue and cost of goods correctly across multiple currencies to produce margin figures that reflect actual economics rather than accounting conventions.
• Inventory turnover and days inventory outstanding: Stock that is not turning is capital that is not working. Inventory turnover by SKU and by category, combined with days inventory outstanding calculated against current sales velocity, gives the purchasing team the data to make replenishment decisions before stockouts occur and liquidation decisions before overstocked lines become write-offs.
• Supplier on-time delivery and quality performance: Trading companies that depend on reliable supplier performance need a dashboard that tracks on-time delivery rate, lead time variability, and quality rejection rate by supplier and by product category. This data changes how supplier relationships are negotiated and how safety stock levels are set.
• Letter of credit and trade finance utilisation: LC utilisation as a proportion of available credit facilities, the value of open LCs by stage, and the ageing of LC obligations relative to expected shipment dates are specific to trading business finance and require data model logic that most generic Power BI implementations do not include.
UAE-Specific Considerations for Trading Company Dashboards
Multi-currency transaction normalisation to AED is the most technically demanding aspect of a trading company Power BI implementation. Purchases made in USD, EUR, and INR alongside AED sales require exchange rate logic applied at the transaction level, not the reporting level, to produce accurate margin figures. VAT input and output tax tracking across import and domestic supply chains needs to be structured in the data model to support FTA compliance reporting. And where the business operates across free zone and mainland entities, the data model needs to handle the entity separation correctly while enabling consolidated group reporting.
For trading companies whose Power BI implementation needs to connect to a custom ERP or multi-entity accounting platform, our ERP Integration Services ensure the data flowing into the Power BI model is accurate, complete, and correctly structured for trading-specific analytics from the first day of live operation.
The single most valuable Power BI dashboard for a Dubai trading company is almost always the daily gross margin dashboard: what was bought, at what cost, in what currency, against what was sold, at what price, in what currency, producing what margin in AED. Everything else builds from this foundation.
Power BI for Dubai Logistics and Freight Companies
The Operational Challenges Power BI Solves in Logistics
Dubai logistics companies manage the intersection of physical asset performance, customer service commitments, and cost control across operations that may span multiple depots, multiple vehicle types, and multiple customer SLA structures simultaneously. The operational questions that define a logistics business's performance are real-time questions: where are the vehicles, are the deliveries on time, what is the fuel cost running at today, and which customer contracts are at risk of SLA breach?
Without Power BI, most Dubai logistics companies answer these questions through a combination of dispatcher calls, WhatsApp updates from drivers, and end-of-day reports from the transport management system. The information is available, but it arrives too late to respond to it effectively. A delivery that is running late becomes a customer complaint rather than a proactive re-routing decision. A vehicle with unusually high fuel consumption is identified at the monthly fleet review rather than the day the anomaly appears. Power BI converts these reactive reporting cycles into proactive operational visibility.
Key KPIs for a Dubai Logistics Company Power BI Implementation
• On-time delivery rate by customer and by route: The primary service quality metric for any logistics operation, this KPI needs to be visible in real time during the delivery day, not compiled at the end of it. A dashboard that shows on-time delivery rate by customer account alongside the current day's live delivery status gives operations managers the information to intervene before SLA breaches occur rather than after.
• Fleet utilisation and vehicle productivity: Fleet utilisation measures the proportion of available vehicle capacity that is generating revenue versus sitting idle or in maintenance. Vehicle productivity measures revenue or job volume per vehicle per day. Both metrics need to be tracked at the individual vehicle level to identify underperforming assets and inform fleet planning decisions.
• Fuel cost per kilometre and fuel efficiency by vehicle: Fuel is typically the second-largest cost item in a logistics business after labour. A dashboard tracking fuel cost per kilometre by vehicle and by route, compared against a defined benchmark, identifies fuel efficiency anomalies at the vehicle level as they occur rather than at the monthly finance close.
• Customer SLA compliance and penalty exposure: Many Dubai logistics contracts include SLA penalty clauses. A dashboard tracking SLA compliance by customer account and estimating the financial exposure from current SLA breach rates gives the commercial team the data to manage customer conversations proactively and gives operations the incentive data to prioritise high-penalty-risk deliveries.
UAE-Specific Considerations for Logistics Dashboards
Cross-border visibility is a specific requirement for UAE logistics companies managing freight between the UAE, Saudi Arabia, and other GCC markets. The data model needs to accommodate shipments that move across customs regimes, that may sit in bonded warehouses for extended periods, and that are tracked through a combination of UAE and international logistics systems. Multi-depot operations across Dubai, Sharjah, Abu Dhabi, and other emirates require the data model to present both consolidated network performance and depot-level detail without requiring separate reports for each location.
For logistics companies whose Power BI implementation connects to a transport management system or fleet management platform with a non-standard API, our Power BI Consulting Services include the custom connector development that brings data from non-standard sources into the Power BI environment reliably and with scheduled refresh.
The logistics dashboard that produces the most immediate operational value is not the most comprehensive one. It is the one that answers the single most important question the operations manager asks every day at 9am: are today's deliveries going to be on time, and if not, which ones are at risk and why?
Power BI for Dubai Real Estate Developers
The Operational Challenges Power BI Solves in Real Estate Development
Dubai real estate developers manage a financial and operational picture that spans years from land acquisition through construction to handover and post-handover management. The financial structure of an off-plan development involves payment plans that collect receivables across a multi-year schedule, construction costs that accumulate in tranches, and sales pipelines that convert at varying rates depending on market conditions, unit type, and project phase.
Without Power BI, a real estate development company's financial position is typically known at the monthly management accounts level, two to three weeks after the period ends. Sales pipeline visibility depends on the sales director's manual compilation of agent reports. Payment milestone collection rates are tracked in spreadsheets by the finance team. Construction progress is reported in site meetings that happen fortnightly. Power BI connects all of these data streams into a live picture of project health that leadership can access every morning without waiting for a report to be compiled.
Key KPIs for a Dubai Real Estate Developer Power BI Implementation
• Unit sales pipeline and reservation conversion rate: The sales pipeline dashboard tracks total units available, units reserved, units with signed SPAs, and units fully paid by project and by unit type. Conversion rate from reservation to SPA and from SPA to full payment, tracked over time and against sales team benchmarks, gives the commercial director the data to manage the sales process proactively rather than reactively.
• Payment milestone collection rate and overdue exposure: Off-plan payment plans create a structured receivables schedule that needs to be tracked at the unit level, the project level, and the aggregate portfolio level. A dashboard showing the value of payment milestones due in the current month, the collection rate against those milestones, and the aged overdue position by buyer segment gives the finance and collections team the daily working list they need without manual report compilation.
• Construction progress against project schedule: Construction cost incurred against budget by project stage, physical completion percentage by work package, and the variance between actual completion and the contractual schedule that underpins sales payment milestones are the key metrics for a construction progress dashboard. Where a construction delay affects the milestone-linked payment plan, the financial impact needs to be visible in the same dashboard rather than in a separate project management report.
• Escrow account balance and drawdown status: UAE real estate regulations require off-plan project revenues to be held in escrow and released to developers based on construction completion milestones certified by approved inspectors. A dashboard tracking escrow balance by project, the next drawdown milestone and its certification status, and the cash available outside escrow for operational use is specific to UAE real estate and requires data model logic that no generic Power BI template includes.
UAE-Specific Considerations for Real Estate Developer Dashboards
DLD registration data, RERA compliance metrics, and escrow account management are UAE-specific requirements that affect both the data sources connected to a real estate developer's Power BI environment and the calculations built into the data model. The payment milestone structures used in UAE off-plan sales, including construction-linked and time-linked payment plan variants, require specific data model logic to produce accurate receivables forecasts and collection rate metrics. Developer dashboards also frequently need to present data in Arabic for boards and government reporting requirements alongside English for operational management use.
For real estate developers whose Power BI implementation needs to connect to a property management system or CRM built specifically for the UAE market, our CRM Integration Services cover the data connections that bring property sales, payment, and buyer management data into the Power BI environment from UAE-specific platforms that do not have standard Power BI connectors.
The real estate developer dashboard that changes how leadership runs the business is the one that combines unit sales status, payment milestone collection, and construction progress in a single integrated view. When these three data streams are visible together, the financial and operational decisions that previously required three separate meetings become possible in one.
What to Look for in a Provider Who Understands Your Industry
A Power BI provider who has built dashboards for twenty generic businesses and a Power BI provider who has built dashboards for five Dubai trading companies are not equally qualified to build the sixth trading company dashboard. The difference is not in their Power BI technical skills, which may be identical. It is in whether they already understand what a letter of credit is, why multi-currency margin calculation requires specific data model logic, and what questions the finance director of a trading company actually asks every day.
That industry knowledge changes the quality of the discovery conversation, the accuracy of the data model design, and the relevance of the KPI selection. It also changes the speed of delivery, because a provider with industry experience does not need to learn the operational context of the business before they can design for it.
Questions to Ask Before Engaging Any Provider
• Can you name a business in our industry that you have built Power BI dashboards for, and can we speak to them: Industry-experienced providers answer this immediately. Generic providers offer to apply their standard methodology to any industry and present this as a strength rather than a limitation.
• What are the three most common data model challenges specific to our industry, and how do you address them: A provider with genuine industry experience names specific challenges without prompting. Multi-currency margin logic for trading, SLA tracking with penalty calculation for logistics, escrow account tracking for real estate. A provider without industry experience gives a generic answer about data quality and integration complexity.
• What UAE-specific configurations does our industry require that a standard Power BI implementation would not include: This question reveals whether the provider has worked in the UAE market with businesses in your sector or is applying a global methodology without local adaptation.
Why the Wrong Provider Costs More Than the Right One
A Power BI implementation built by a provider without industry experience requires significantly more revision cycles to produce dashboards that actually fit the business's operational questions. The initial delivery produces something technically correct but operationally generic. The business provides feedback. The provider revises. The cycle repeats until either the dashboards reach an acceptable level of relevance or the relationship ends without the business having what it needed.
Each revision cycle consumes time, budget, and the internal goodwill that makes Power BI adoption successful. The businesses that get the most from Power BI are the ones that commission it from a provider who already understands their industry well enough to ask the right questions in the first discovery session rather than learning the business's operational context through successive revision cycles.
For businesses in trading, logistics, or real estate that want to assess whether their current Power BI environment is built correctly for their industry's operational requirements, our Power BI Consulting Services include structured data model and dashboard reviews that identify gaps between what the current implementation shows and what the industry context requires.
A dashboard built for your industry does not just show you more data. It shows you the right data, structured around the decisions your industry requires you to make daily, drawing from the data sources your operational systems actually generate. That specificity is the difference between a dashboard you check every morning and one you open once and close.
The Right Dashboard Is Built for Your Industry, Not for the Platform's Demo Library
Power BI is the same platform whether it is deployed for a trading company, a logistics operator, or a real estate developer. What changes completely is the data model, the KPI selection, the dashboard structure, and the UAE-specific configuration that makes the numbers produced by the dashboard reflect how the business actually operates rather than how a generic business template assumes it might.
Power BI dashboard development services in Dubai that bring genuine industry experience to the engagement produce dashboards that fit the business from the first review session rather than through multiple correction cycles. The trading company finance director recognises the margin analysis as the one they actually need. The logistics operations manager sees the delivery status view they have always wanted but never had. The real estate developer's CEO can read the project health dashboard without needing it explained.
Industry context is not a premium feature of Power BI development. It is the prerequisite for a Power BI implementation that does what it was commissioned to do: change how the business makes decisions by making the right data visible in the right format at the right time.
Ready to build Power BI dashboards designed specifically for how your Dubai business operates, not for how a generic business template assumes it might? Start the conversation with Digital Web Consulting through our Power BI Dashboard Development Services page